
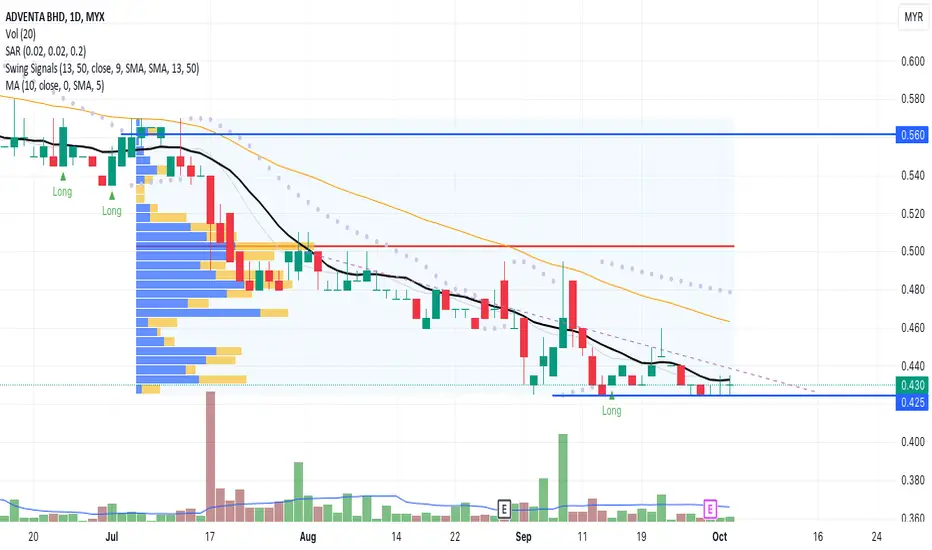
The candlestick formation pattern indicates the end of the existing downtrend pattern with RSI conforming to the candlestick pattern due to fresh buying on ADVENTA. Yet, the result in volume is not yet significant.
The MACD indicator indicates a reversal pattern towards the uptrend pattern.
Let's save ADVENTA in WL and watch out for significant price movement with the result in volume towards a new peak price.
R 0.500
S 0.400
The MACD indicator indicates a reversal pattern towards the uptrend pattern.
Let's save ADVENTA in WL and watch out for significant price movement with the result in volume towards a new peak price.
R 0.500
S 0.400

免責聲明
這些資訊和出版物並非旨在提供,也不構成TradingView提供或認可的任何形式的財務、投資、交易或其他類型的建議或推薦。請閱讀使用條款以了解更多資訊。
免責聲明
這些資訊和出版物並非旨在提供,也不構成TradingView提供或認可的任何形式的財務、投資、交易或其他類型的建議或推薦。請閱讀使用條款以了解更多資訊。