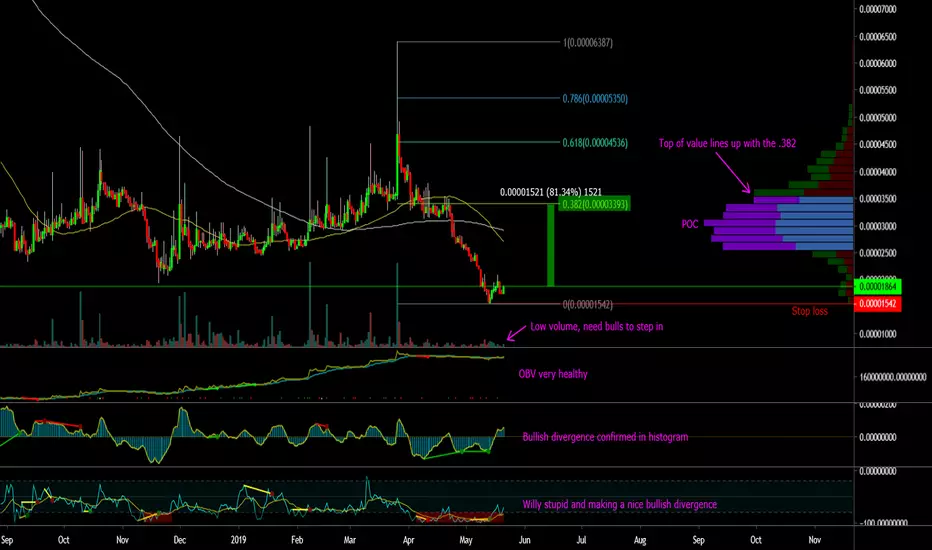
Looking at ADX on the daily chart
*Willy stupidly over sold and making a nice bullish divergence
* Histogram making lower highs and confirming a bullish divergence
* OBV strong and healthy, people are accumulating
* Currently bottom of value low and could see a run up to the POC where the .382 fib lines up
* Target is around the 3300 sat mark
* Would love to see the bulls step in and create this bottom here.
* ADX has made a 618 retrace on a smaller time frame for a lower high (Double bottom)
* STOP LOSS will be a touch under the red line
* Don't forget to hit that like button and follow me on Trading View and Twitter for more chart analysis :)

免責聲明
這些資訊和出版物並非旨在提供,也不構成TradingView提供或認可的任何形式的財務、投資、交易或其他類型的建議或推薦。請閱讀使用條款以了解更多資訊。
免責聲明
這些資訊和出版物並非旨在提供,也不構成TradingView提供或認可的任何形式的財務、投資、交易或其他類型的建議或推薦。請閱讀使用條款以了解更多資訊。