做空
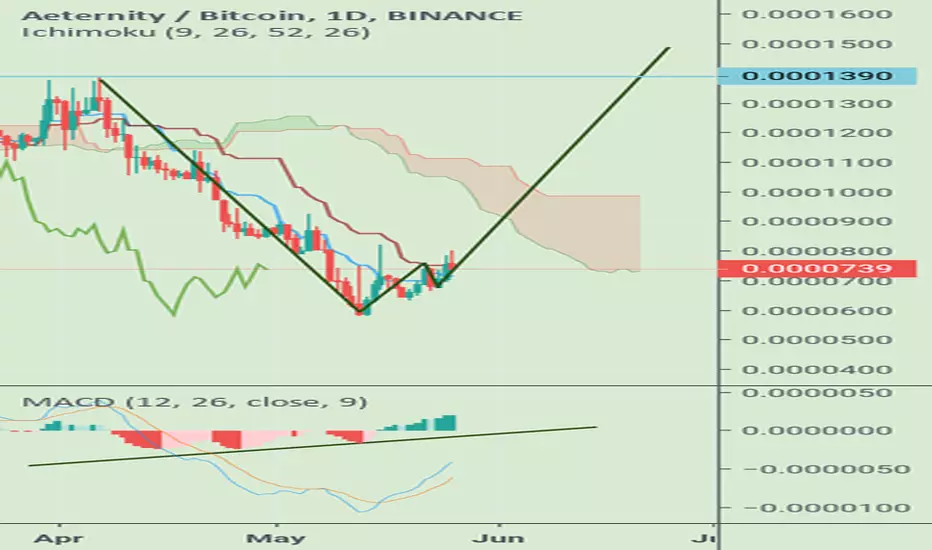
AE/BTC 1D
Hello friends
We are here AE/BTC charts see
1.In the daily chart after 49 days opens candel top of the "Tenkan sen" line on ichimuko indicator ; this means the break resistance short term
2.buliesh divergens in macd indicator
3.nice double bottom pattern in this chart
So i think in short time we see 1500sat but in 1390sat area we have big resistance
I hope this analysis be useful to you. Definitely a financial advice is not

免責聲明
這些資訊和出版物並非旨在提供,也不構成TradingView提供或認可的任何形式的財務、投資、交易或其他類型的建議或推薦。請閱讀使用條款以了解更多資訊。