
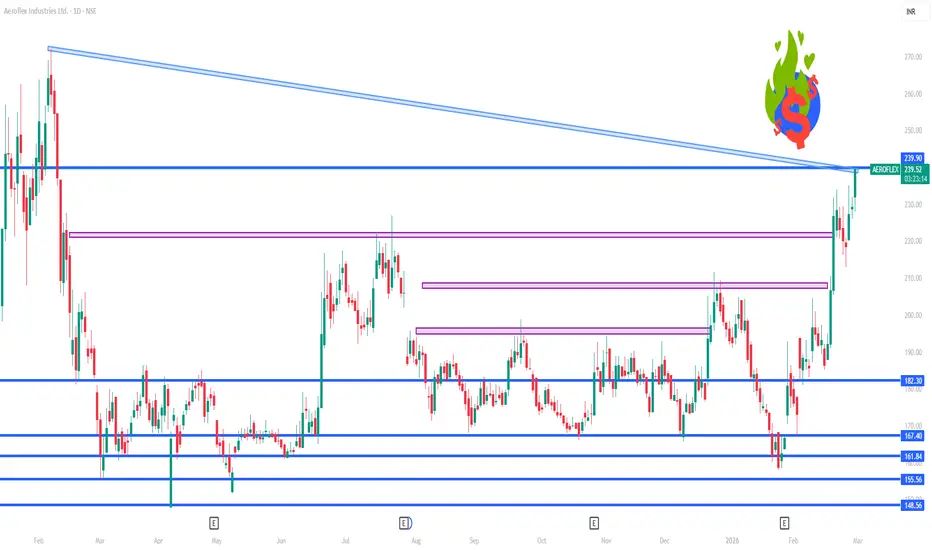
📊 Current Status
The stock is trading around ~₹229 – ₹234 range on NSE (latest session data).
🔑 Daily Pivot & Key Levels
📈 Resistance Levels (Upside Targets)
These are key levels where price may face selling pressure:
R1: ~₹232–₹234 (first major resistance)
R2: ~₹242–₹243 (next resistance)
R3: ~₹249–₹250+ (extended area)
Short-term upside is likely capped unless price sustains above the ₹234 zone.
📉 Support Levels (Downside Defense)
These levels could act as pullback buffers:
S1: ~₹220–₹223 (immediate support)
S2: ~₹212–₹215 (mid support)
S3: ~₹203–₹206 (deeper support)
Break below S1 would signal weakness and possible deeper correction toward S2/S3.
🟡 Pivot Reference Point
Pivot: ~₹227–₹231 (central reference of daily price range)
Price above pivot suggests bullish bias for the day; below pivot suggests bearish bias.
📈 Technical Indicators on Daily Chart
Short & long-term moving averages are positioned bullishly, suggesting an overall uptrend bias.
RSI (~65) suggests strength but not extreme overbought.
MACD and other indicators on daily frame give a bullish lean.
📌 Daily Trading Notes
Bullish scenario: Sustained trade above the pivot and above ₹234 may open the way toward ₹242–₹250+.
Bearish scenario: Failure near resistance or breakdown below ₹220–₹223 could trigger a pullback to ₹212–₹206.
Intraday range often sees volatility (~₹10–₹15) on such stocks.
The stock is trading around ~₹229 – ₹234 range on NSE (latest session data).
🔑 Daily Pivot & Key Levels
📈 Resistance Levels (Upside Targets)
These are key levels where price may face selling pressure:
R1: ~₹232–₹234 (first major resistance)
R2: ~₹242–₹243 (next resistance)
R3: ~₹249–₹250+ (extended area)
Short-term upside is likely capped unless price sustains above the ₹234 zone.
📉 Support Levels (Downside Defense)
These levels could act as pullback buffers:
S1: ~₹220–₹223 (immediate support)
S2: ~₹212–₹215 (mid support)
S3: ~₹203–₹206 (deeper support)
Break below S1 would signal weakness and possible deeper correction toward S2/S3.
🟡 Pivot Reference Point
Pivot: ~₹227–₹231 (central reference of daily price range)
Price above pivot suggests bullish bias for the day; below pivot suggests bearish bias.
📈 Technical Indicators on Daily Chart
Short & long-term moving averages are positioned bullishly, suggesting an overall uptrend bias.
RSI (~65) suggests strength but not extreme overbought.
MACD and other indicators on daily frame give a bullish lean.
📌 Daily Trading Notes
Bullish scenario: Sustained trade above the pivot and above ₹234 may open the way toward ₹242–₹250+.
Bearish scenario: Failure near resistance or breakdown below ₹220–₹223 could trigger a pullback to ₹212–₹206.
Intraday range often sees volatility (~₹10–₹15) on such stocks.

Contact Knowledgehub for a detailed consultation: Dm on WhatsApp: [wa.link/a2o0kz]-
Phone No: [+91 93102 26243]-
Email: [tradingviewknowledgehub@gmail.com]---
-- Let’s achieve success together!
Phone No: [+91 93102 26243]-
Email: [tradingviewknowledgehub@gmail.com]---
-- Let’s achieve success together!
相關出版品
免責聲明
這些資訊和出版物並非旨在提供,也不構成TradingView提供或認可的任何形式的財務、投資、交易或其他類型的建議或推薦。請閱讀使用條款以了解更多資訊。
Contact Knowledgehub for a detailed consultation: Dm on WhatsApp: [wa.link/a2o0kz]-
Phone No: [+91 93102 26243]-
Email: [tradingviewknowledgehub@gmail.com]---
-- Let’s achieve success together!
Phone No: [+91 93102 26243]-
Email: [tradingviewknowledgehub@gmail.com]---
-- Let’s achieve success together!
相關出版品
免責聲明
這些資訊和出版物並非旨在提供,也不構成TradingView提供或認可的任何形式的財務、投資、交易或其他類型的建議或推薦。請閱讀使用條款以了解更多資訊。