
Market Structure
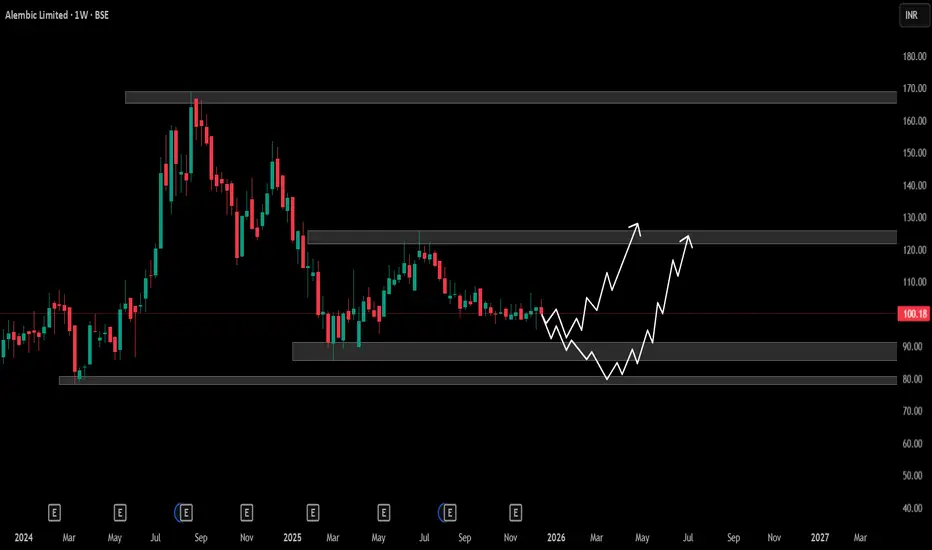
On the weekly timeframe, the stock has been in a broad consolidation phase after a sharp decline from the ₹160–165 supply zone.
Price is currently trading near ₹100, which lies in the middle of a long-term range, indicating indecision and low momentum.
Multiple rejections from higher levels suggest that sellers remain active near resistance zones.
Key Demand & Supply Zones
Major Support Zone: ₹80–85
This is a long-term demand area where strong buying previously emerged.
Intermediate Support: ₹90–92
Short-term support; loss of this level may accelerate downside.
Immediate Resistance: ₹120–125
Strong supply zone; price needs acceptance above this level for trend reversal.
Major Resistance: ₹165–170
Previous distribution zone and long-term supply area.
Price Action Outlook
As long as price holds above ₹80–85, the structure remains range-bound with accumulation potential.
A pullback towards ₹90–85, followed by strong bullish price action, can act as a base for medium-term recovery.
A decisive weekly close above ₹125 would signal a trend change and open upside towards higher resistance zones.
Until then, rallies are likely to face selling pressure near ₹120–125.
Bias
Neutral to mildly bearish below ₹120
Range-bound between ₹85 and ₹125
Bullish confirmation only on sustained breakout above ₹125
Disclaimer
This analysis is based purely on technical analysis and historical price behavior. It is provided for educational purposes only and should not be considered as investment or trading advice.
On the weekly timeframe, the stock has been in a broad consolidation phase after a sharp decline from the ₹160–165 supply zone.
Price is currently trading near ₹100, which lies in the middle of a long-term range, indicating indecision and low momentum.
Multiple rejections from higher levels suggest that sellers remain active near resistance zones.
Key Demand & Supply Zones
Major Support Zone: ₹80–85
This is a long-term demand area where strong buying previously emerged.
Intermediate Support: ₹90–92
Short-term support; loss of this level may accelerate downside.
Immediate Resistance: ₹120–125
Strong supply zone; price needs acceptance above this level for trend reversal.
Major Resistance: ₹165–170
Previous distribution zone and long-term supply area.
Price Action Outlook
As long as price holds above ₹80–85, the structure remains range-bound with accumulation potential.
A pullback towards ₹90–85, followed by strong bullish price action, can act as a base for medium-term recovery.
A decisive weekly close above ₹125 would signal a trend change and open upside towards higher resistance zones.
Until then, rallies are likely to face selling pressure near ₹120–125.
Bias
Neutral to mildly bearish below ₹120
Range-bound between ₹85 and ₹125
Bullish confirmation only on sustained breakout above ₹125
Disclaimer
This analysis is based purely on technical analysis and historical price behavior. It is provided for educational purposes only and should not be considered as investment or trading advice.

免責聲明
這些資訊和出版物並非旨在提供,也不構成TradingView提供或認可的任何形式的財務、投資、交易或其他類型的建議或推薦。請閱讀使用條款以了解更多資訊。