
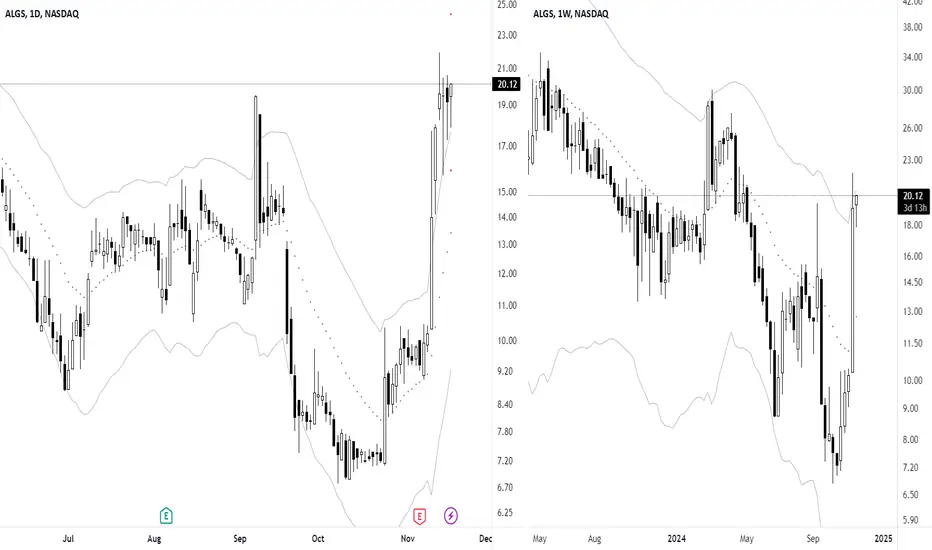
When stock showed up in screener showed a bullish continuation pattern on daily timeframe and a potential failure test / pullback on the higher timeframe downtrend, a bit near mean but was added to watchlist.
Execution chart.
Trade Overview
• Structure: Bullish Continuation (D)
• Position: Near Mean (D)
• Entry Trigger: Breakout (D)
Entry Details
• Entry Price: 11.13
• Stop Price: 9.38
• Target Price: 12.96
• Expected Risk/Reward: 1.05R
Exit Strategy
• Exit Price: 14.47 / 1.91R

Technical Trading: Research and Application
stockleave.com/
stockleave.com/
免責聲明
這些資訊和出版物並非旨在提供,也不構成TradingView提供或認可的任何形式的財務、投資、交易或其他類型的建議或推薦。請閱讀使用條款以了解更多資訊。
Technical Trading: Research and Application
stockleave.com/
stockleave.com/
免責聲明
這些資訊和出版物並非旨在提供,也不構成TradingView提供或認可的任何形式的財務、投資、交易或其他類型的建議或推薦。請閱讀使用條款以了解更多資訊。