
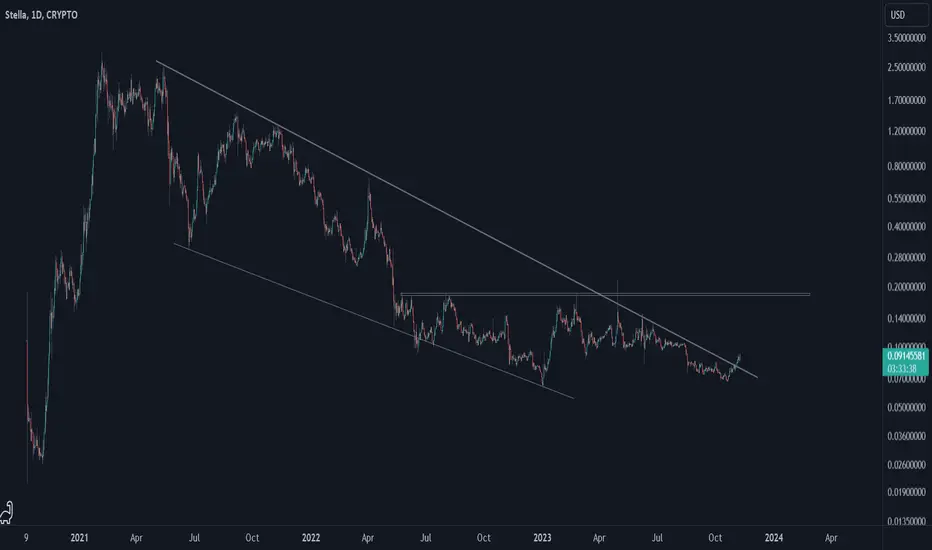
Stella's chart is straightforward; a sharp upward move followed by a lengthy correction wave unfolded in a big descending triangle pattern. Recently, ALPHA broke the major downtrend line. Let's see how up Stella can go.
註釋
Alpha is going crazy!
註釋
So, after Alpha frenzy ended, price came down. Alpha need to break this major horizontal resistance area in order to confirm reversal. Let's see what happens.
註釋
So, Alpha couldn't break the major horizontal resistance area, then went down. It seems Alpha has made an inverted wedge/triangle pattern. Recently, Alpha reached the bottom and then broke the downtrend line. Let's see if Alpha can reach the inverted pattern's top or even break it.
交易進行
So, Alpha is going up toward the inverted wedge's upper line. Let's see what happens.

免責聲明
這些資訊和出版物並非旨在提供,也不構成TradingView提供或認可的任何形式的財務、投資、交易或其他類型的建議或推薦。請閱讀使用條款以了解更多資訊。
免責聲明
這些資訊和出版物並非旨在提供,也不構成TradingView提供或認可的任何形式的財務、投資、交易或其他類型的建議或推薦。請閱讀使用條款以了解更多資訊。