
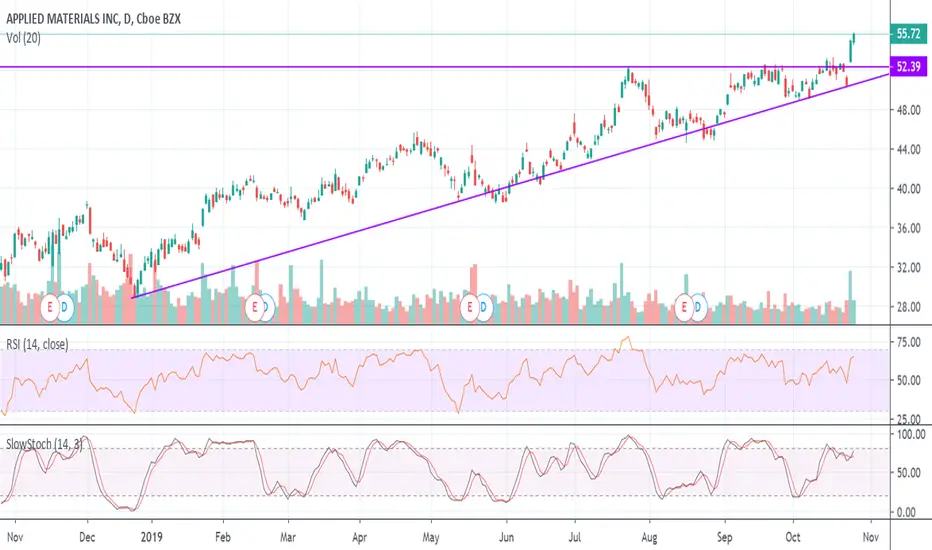
AMAT is a rather standard chart. An Ascending Triangle pattern has formed since the Christmas Eve low with only a couple of instances where the rising support line was broken. Each time the line was broken it was by a small amount & each time the line was regained shortly after. A multiple top pattern dating from late July led to the resistance line across the top of the chart. The breakout happened on October 24th. I am just waiting for the eventual pullback re-test to see if resistance has now become support.
註釋
Stock re-tested on Halloween & has continued rising. It is near overbought but got to let them run.
免責聲明
這些資訊和出版物並非旨在提供,也不構成TradingView提供或認可的任何形式的財務、投資、交易或其他類型的建議或推薦。請閱讀使用條款以了解更多資訊。
免責聲明
這些資訊和出版物並非旨在提供,也不構成TradingView提供或認可的任何形式的財務、投資、交易或其他類型的建議或推薦。請閱讀使用條款以了解更多資訊。