 AMC
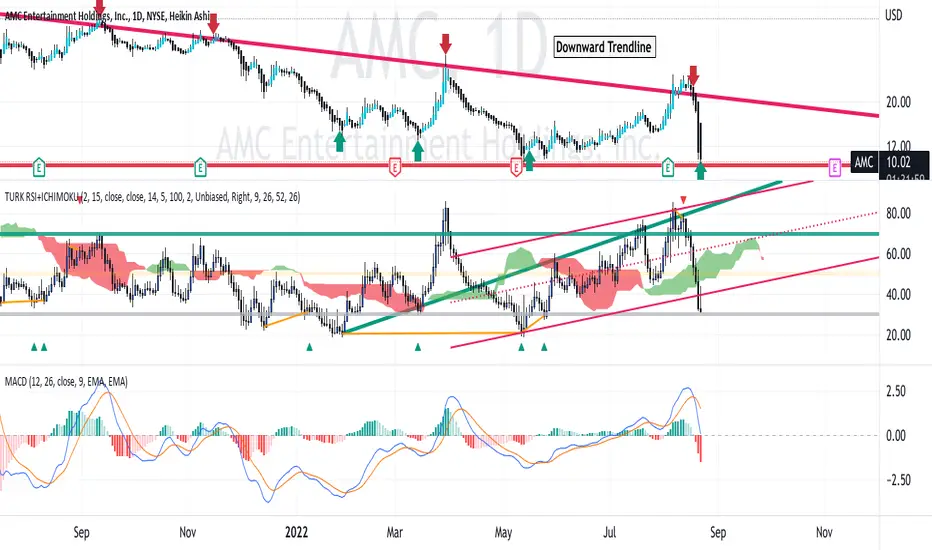
AMCAMC since the parabolic move May- June 2021
has been in a flat bottom triangle pattern with "touches"
on both the support trendline and the upper resistance trendline.
In the past several trading days, with the volatility of the APE special class dividend stock,
AMC has gone up to the upper line and now is now again at the $10 range.
The MACD and Relative Strength are weak. This is consistent with buying weakness
and low then selling above that.
While waiting for a true breakout of the triangle, I see a long swing setup
as buying the bottom at $10 and observing for a rise to the upper trendline
with a target of $19. I will set a stop loss below the triangle at $9.50
This would offer a reward on risk of 19X. I well realize that market
catalysts can trump the pattern anytime and assume that risk.
Go Apes !
交易進行
AMC up 3% from low of $9.31
免責聲明
這些資訊和出版物並非旨在提供,也不構成TradingView提供或認可的任何形式的財務、投資、交易或其他類型的建議或推薦。請閱讀使用條款以了解更多資訊。
免責聲明
這些資訊和出版物並非旨在提供,也不構成TradingView提供或認可的任何形式的財務、投資、交易或其他類型的建議或推薦。請閱讀使用條款以了解更多資訊。