
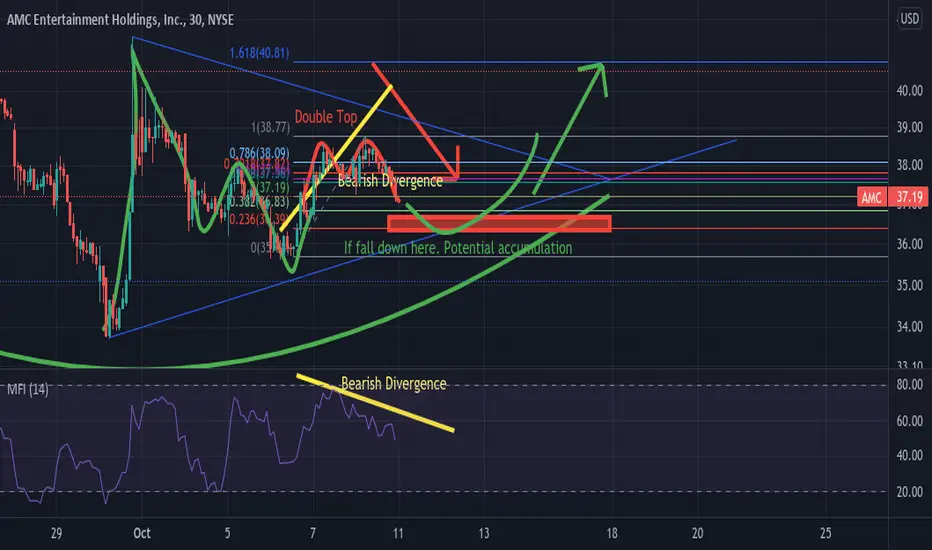
What I thought could be seen a breakout today turns what to bearish double top. What I notice yesterday was a bearish divergence in the 15 min chart today the 30 minute chart confirms it. As the price heads higher the MFI indicators highs drops. The key levels price I will be looking at is $36.30-$36.70. If that key support is hold what I seen is probably an extension of an Inverse Right Shoulder. Meaning that there is still potential of the upside next week. And if its it true there's a potential bear trap at the $36 range. If it drops lower $36. I will readjust.

免責聲明
這些資訊和出版物並非旨在提供,也不構成TradingView提供或認可的任何形式的財務、投資、交易或其他類型的建議或推薦。請閱讀使用條款以了解更多資訊。