
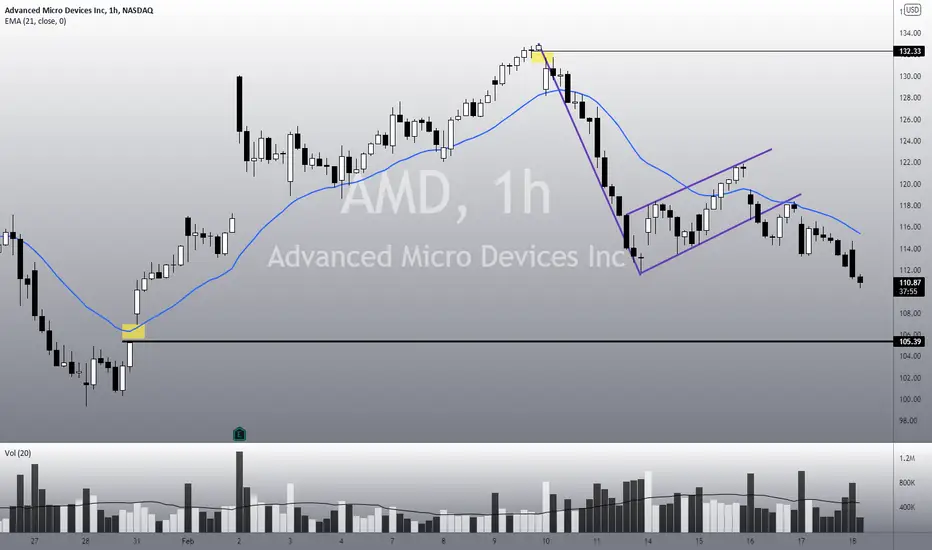
Hello traders and investors! Let’s see how AMD is doing today!
First, it did trigger the Bearish Flag we mentioned in our last analysis, and it seems it is just heading to the $ 105 (previous gap). The link to my previous analysis is below this post.
The trend is clearly bearish, and there’s not a single bullish sign around, and this is the only thing that could save AMD now. Remember, trends persist until a clear reversal occurs ( Dow Theory 6th tenet). No clear reversal sign? The bear trend will persist. Trading is reactive, not predictive.

In the daily chart, we see that AMD is losing its 61.8% retracement, indicating a possible further drop. Our previous support in the daily chart is the $ 99.67 area, and we can see this point better from the weekly perspective:

Last week, we did a a candlestick pattern called Dark Cloud Cover, just under the 21 ema, and we are triggering this pattern this week. This reinforces a bearish thesis, and the area at $ 99.67 seems quite important.
This point was a resistance on Jan 2021, was a support multiple times in Sep – Oct last year, and was a support last month too. As long as we don’t see nothing surprising on AMD, the $ 99.67 is our next target.
I’ll follow it closely and keep you guys updated. In this case, remember to follow me to keep in touch with my daily analyses.
First, it did trigger the Bearish Flag we mentioned in our last analysis, and it seems it is just heading to the $ 105 (previous gap). The link to my previous analysis is below this post.
The trend is clearly bearish, and there’s not a single bullish sign around, and this is the only thing that could save AMD now. Remember, trends persist until a clear reversal occurs ( Dow Theory 6th tenet). No clear reversal sign? The bear trend will persist. Trading is reactive, not predictive.
In the daily chart, we see that AMD is losing its 61.8% retracement, indicating a possible further drop. Our previous support in the daily chart is the $ 99.67 area, and we can see this point better from the weekly perspective:
Last week, we did a a candlestick pattern called Dark Cloud Cover, just under the 21 ema, and we are triggering this pattern this week. This reinforces a bearish thesis, and the area at $ 99.67 seems quite important.
This point was a resistance on Jan 2021, was a support multiple times in Sep – Oct last year, and was a support last month too. As long as we don’t see nothing surprising on AMD, the $ 99.67 is our next target.
I’ll follow it closely and keep you guys updated. In this case, remember to follow me to keep in touch with my daily analyses.

免責聲明
這些資訊和出版物並非旨在提供,也不構成TradingView提供或認可的任何形式的財務、投資、交易或其他類型的建議或推薦。請閱讀使用條款以了解更多資訊。