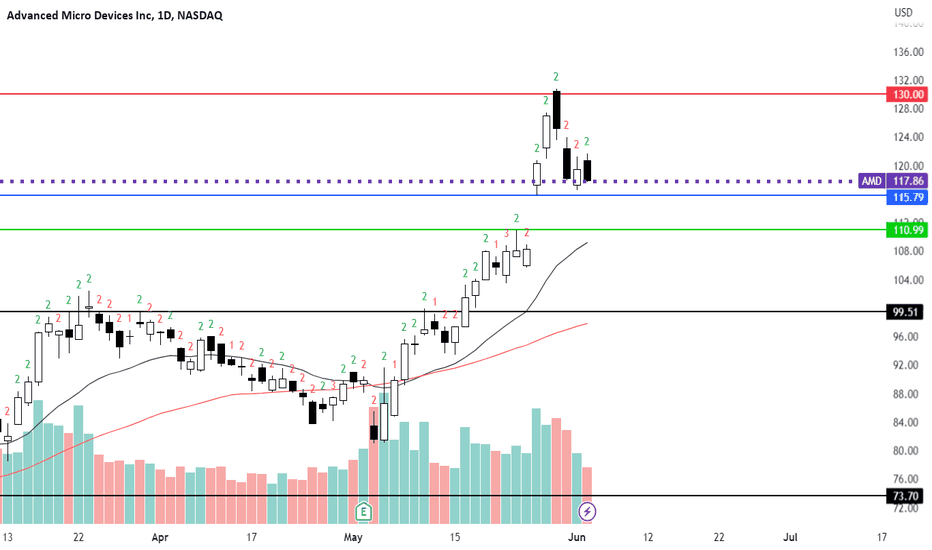
Two weeks ago, I published a bearish trading idea on  AMD saying that I would go short if it broke $115.80. Apparently it didn't break, so didn't take any trades. Here is the link to that post:
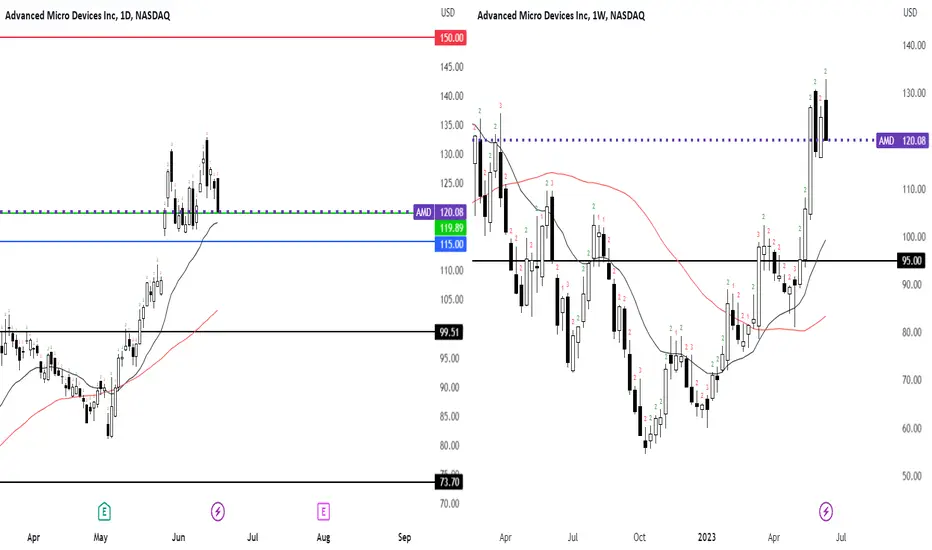
This week, we have an interesting scenario. Its a double top on daily chart and an outside bar. Additionally there is a divergence on stochastics. On weekly chart its a failed 2U. Its seems overextended and stochastics is overbought.
Idea is to go short at low of Friday's candle ($119.90). This will trigger a 3-2D on daily and a 2U-2D on weekly. Target could be at least $115.
AMD saying that I would go short if it broke $115.80. Apparently it didn't break, so didn't take any trades. Here is the link to that post:This week, we have an interesting scenario. Its a double top on daily chart and an outside bar. Additionally there is a divergence on stochastics. On weekly chart its a failed 2U. Its seems overextended and stochastics is overbought.
Idea is to go short at low of Friday's candle ($119.90). This will trigger a 3-2D on daily and a 2U-2D on weekly. Target could be at least $115.

免責聲明
這些資訊和出版物並非旨在提供,也不構成TradingView提供或認可的任何形式的財務、投資、交易或其他類型的建議或推薦。請閱讀使用條款以了解更多資訊。
免責聲明
這些資訊和出版物並非旨在提供,也不構成TradingView提供或認可的任何形式的財務、投資、交易或其他類型的建議或推薦。請閱讀使用條款以了解更多資訊。