Advanced Micro Devices  AMD has gained some 250% over the past 12 months, including rising more than 180% in roughly four months since hitting its 2026 low on March 3. Let's see what the chip giant's fundamental and technical analysis can show us.
AMD's Fundamental Analysis
TD Cowen's Joshua Buchalter this week boosted his AMD price target to $675 from a previous $600 (and the $548.13 the chip firm closed at on Tuesday).
Buchalter also reiterated his "Buy" rating for the stock, writing in a research note about major artificial-intelligence product launches that he expects from the firm during 2026's second half. He also believes CPU demand will remain quite strong, bolstered by agentic AI.
Buchalter is a top-rated sell-side analyst, with TipRanks noting that he's built a 77% success rate and 68.9% average return over the past two years.
Just a few days earlier, Ruben Roy took over AMD coverage for Stifel Nicolaus and promptly rated the chip stock a "Buy," increasing his firm's target price to $635 from an earlier $475.
Roy has had a 79% success rate and 111.1% average return over the past two years, according to TipRanks.
All in, AMD has 28 "Buy" ratings, eight "Hold" designations and zero "Sells" among the 36 analysts that TipRanks follows who cover the stock.
Their 12-month price targets range from a $725 high to a $250 low, with the average forecast predicting the stock will hit $531.78.
Meanwhile, Wall Street expects AMD to release its Q2 results in about three weeks on or about Aug. 4, with analysts' consensus view calling for $1.61 in adjusted earnings per share on roughly $11.1 billion of revenue. (The range of expectations spans from $1.48 to $1.74 in adjusted EPS and $11.1 billion to $11.65 billion of revenue.)
If AMD meets the consensus estimate, that would represent a 235.4% year-over-year gain from the $0.48 in adjusted EPS that the firm reported in the year-ago period. AMD would also see around 44% growth from Q2 2025's $7.7 billion in sales.
The Street is also looking for 43% of sales growth for 2026 as a whole, as well as 56% for 2027.
In fact, 36 of the 40 sell-side analysts that I know of who over AMD have increased their earnings estimates since the quarter began, while just one analyst has cut their forecast. (Three have made no changes.)
AMD's Technical Analysis
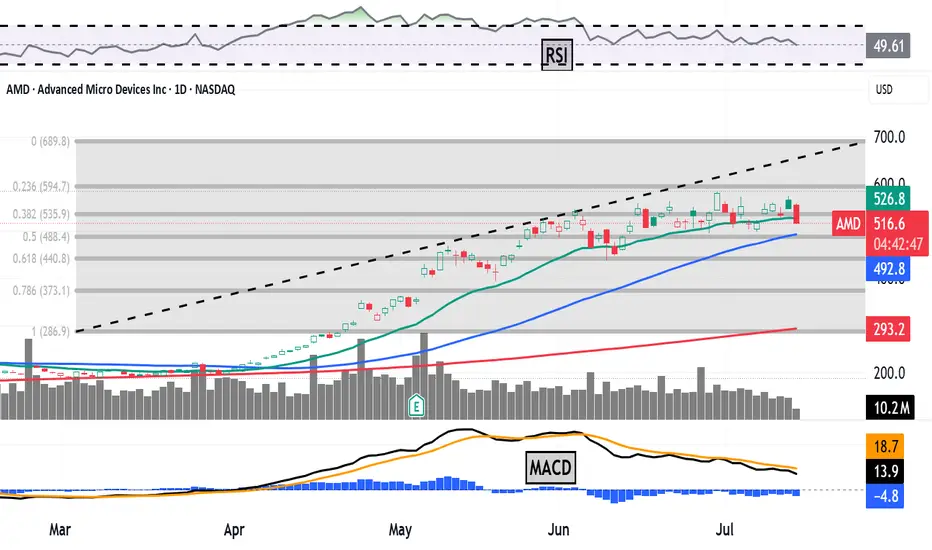
Next, let's go to AMD's year-to-date chart as of Monday afternoon (July 13):

Readers will see that AMD recently tried to break out of a rising-wedge pattern of bearish reversal that ran from late March into early July, as marked with orange shading above.
While that breakout failed, AMD has now found consistent support just above the 23.6% Fibonacci retracement level of its late-March/late-June rally, as denoted by the gray lines and shading in the chart.
Admittedly, the shares have struggled to hold their 21-day Exponential Average (or "EMA," marked with a green line at $526.90).
AMD has been both above and below the 21-day EMA line in recent weeks, which very likely implies that the swing crowd is mixed on what to do with the stock at these levels.
The share price could even fall all the way back to its 50-day Simple Moving Average (or "SMA," denoted by a blue line at $486.10). That's where the stock would likely face a test by professional portfolio managers.
Conversely, getting swing traders behind AMD would probably require a more bullish posture to the stock's daily Moving Average Convergence Divergence indicator (or "MACD," marked with blue bars, a black line and a gold line at the chart's bottom).
The 12-day EMA (the black line) would have to cross over the 26-day EMA (the gold line), while the histogram of the 9-day EMA the blue bars) would have to move into positive territory. All of that would be bullish.
Meanwhile, AMD's Relative Strength Index (or "RSI," the gray line at the chart's top) is slightly better than neutral, but not really a factor in this analysis.
(Moomoo Technologies Inc. Markets Commentator Stephen "Sarge" Guilfoyle was long AMD at the time of writing this column.)
This article discusses technical analysis, other approaches, including fundamental analysis, may offer very different views. The examples provided are for illustrative purposes only and are not intended to be reflective of the results you can expect to achieve. Specific security charts used are for illustrative purposes only and are not a recommendation, offer to sell, or a solicitation of an offer to buy any security. Past investment performance does not indicate or guarantee future success. Returns will vary, and all investments carry risks, including loss of principal. This content is also not a research report and is not intended to serve as the basis for any investment decision. The information contained in this article does not purport to be a complete description of the securities, markets, or developments referred to in this material. Moomoo and its affiliates make no representation or warranty as to the article's adequacy, completeness, accuracy or timeliness for any particular purpose of the above content. Furthermore, there is no guarantee that any statements, estimates, price targets, opinions or forecasts provided herein will prove to be correct.
The Analyst Ratings feature comes from TipRanks, an independent third party. The accuracy, completeness, or reliability cannot be guaranteed and should not be relied upon as a primary basis for any investment decision. The target prices are intended for informational purposes only, not recommendations, and are also not guarantees of future results.
Moomoo is a financial information and trading app offered by Moomoo Technologies Inc. In the U.S., investment products and services on Moomoo are offered by Moomoo Financial Inc., Member FINRA/SIPC.
TradingView is an independent third party not affiliated with Moomoo Financial Inc., Moomoo Technologies Inc., or its affiliates. Moomoo Financial Inc. and its affiliates do not endorse, represent or warrant the completeness and accuracy of the data and information available on the TradingView platform and are not responsible for any services provided by the third-party platform.
AMD has gained some 250% over the past 12 months, including rising more than 180% in roughly four months since hitting its 2026 low on March 3. Let's see what the chip giant's fundamental and technical analysis can show us.AMD's Fundamental Analysis
TD Cowen's Joshua Buchalter this week boosted his AMD price target to $675 from a previous $600 (and the $548.13 the chip firm closed at on Tuesday).
Buchalter also reiterated his "Buy" rating for the stock, writing in a research note about major artificial-intelligence product launches that he expects from the firm during 2026's second half. He also believes CPU demand will remain quite strong, bolstered by agentic AI.
Buchalter is a top-rated sell-side analyst, with TipRanks noting that he's built a 77% success rate and 68.9% average return over the past two years.
Just a few days earlier, Ruben Roy took over AMD coverage for Stifel Nicolaus and promptly rated the chip stock a "Buy," increasing his firm's target price to $635 from an earlier $475.
Roy has had a 79% success rate and 111.1% average return over the past two years, according to TipRanks.
All in, AMD has 28 "Buy" ratings, eight "Hold" designations and zero "Sells" among the 36 analysts that TipRanks follows who cover the stock.
Their 12-month price targets range from a $725 high to a $250 low, with the average forecast predicting the stock will hit $531.78.
Meanwhile, Wall Street expects AMD to release its Q2 results in about three weeks on or about Aug. 4, with analysts' consensus view calling for $1.61 in adjusted earnings per share on roughly $11.1 billion of revenue. (The range of expectations spans from $1.48 to $1.74 in adjusted EPS and $11.1 billion to $11.65 billion of revenue.)
If AMD meets the consensus estimate, that would represent a 235.4% year-over-year gain from the $0.48 in adjusted EPS that the firm reported in the year-ago period. AMD would also see around 44% growth from Q2 2025's $7.7 billion in sales.
The Street is also looking for 43% of sales growth for 2026 as a whole, as well as 56% for 2027.
In fact, 36 of the 40 sell-side analysts that I know of who over AMD have increased their earnings estimates since the quarter began, while just one analyst has cut their forecast. (Three have made no changes.)
AMD's Technical Analysis
Next, let's go to AMD's year-to-date chart as of Monday afternoon (July 13):
Readers will see that AMD recently tried to break out of a rising-wedge pattern of bearish reversal that ran from late March into early July, as marked with orange shading above.
While that breakout failed, AMD has now found consistent support just above the 23.6% Fibonacci retracement level of its late-March/late-June rally, as denoted by the gray lines and shading in the chart.
Admittedly, the shares have struggled to hold their 21-day Exponential Average (or "EMA," marked with a green line at $526.90).
AMD has been both above and below the 21-day EMA line in recent weeks, which very likely implies that the swing crowd is mixed on what to do with the stock at these levels.
The share price could even fall all the way back to its 50-day Simple Moving Average (or "SMA," denoted by a blue line at $486.10). That's where the stock would likely face a test by professional portfolio managers.
Conversely, getting swing traders behind AMD would probably require a more bullish posture to the stock's daily Moving Average Convergence Divergence indicator (or "MACD," marked with blue bars, a black line and a gold line at the chart's bottom).
The 12-day EMA (the black line) would have to cross over the 26-day EMA (the gold line), while the histogram of the 9-day EMA the blue bars) would have to move into positive territory. All of that would be bullish.
Meanwhile, AMD's Relative Strength Index (or "RSI," the gray line at the chart's top) is slightly better than neutral, but not really a factor in this analysis.
(Moomoo Technologies Inc. Markets Commentator Stephen "Sarge" Guilfoyle was long AMD at the time of writing this column.)
This article discusses technical analysis, other approaches, including fundamental analysis, may offer very different views. The examples provided are for illustrative purposes only and are not intended to be reflective of the results you can expect to achieve. Specific security charts used are for illustrative purposes only and are not a recommendation, offer to sell, or a solicitation of an offer to buy any security. Past investment performance does not indicate or guarantee future success. Returns will vary, and all investments carry risks, including loss of principal. This content is also not a research report and is not intended to serve as the basis for any investment decision. The information contained in this article does not purport to be a complete description of the securities, markets, or developments referred to in this material. Moomoo and its affiliates make no representation or warranty as to the article's adequacy, completeness, accuracy or timeliness for any particular purpose of the above content. Furthermore, there is no guarantee that any statements, estimates, price targets, opinions or forecasts provided herein will prove to be correct.
The Analyst Ratings feature comes from TipRanks, an independent third party. The accuracy, completeness, or reliability cannot be guaranteed and should not be relied upon as a primary basis for any investment decision. The target prices are intended for informational purposes only, not recommendations, and are also not guarantees of future results.
Moomoo is a financial information and trading app offered by Moomoo Technologies Inc. In the U.S., investment products and services on Moomoo are offered by Moomoo Financial Inc., Member FINRA/SIPC.
TradingView is an independent third party not affiliated with Moomoo Financial Inc., Moomoo Technologies Inc., or its affiliates. Moomoo Financial Inc. and its affiliates do not endorse, represent or warrant the completeness and accuracy of the data and information available on the TradingView platform and are not responsible for any services provided by the third-party platform.

免責聲明
這些資訊和出版物並非旨在提供,也不構成TradingView提供或認可的任何形式的財務、投資、交易或其他類型的建議或推薦。請閱讀使用條款以了解更多資訊。