
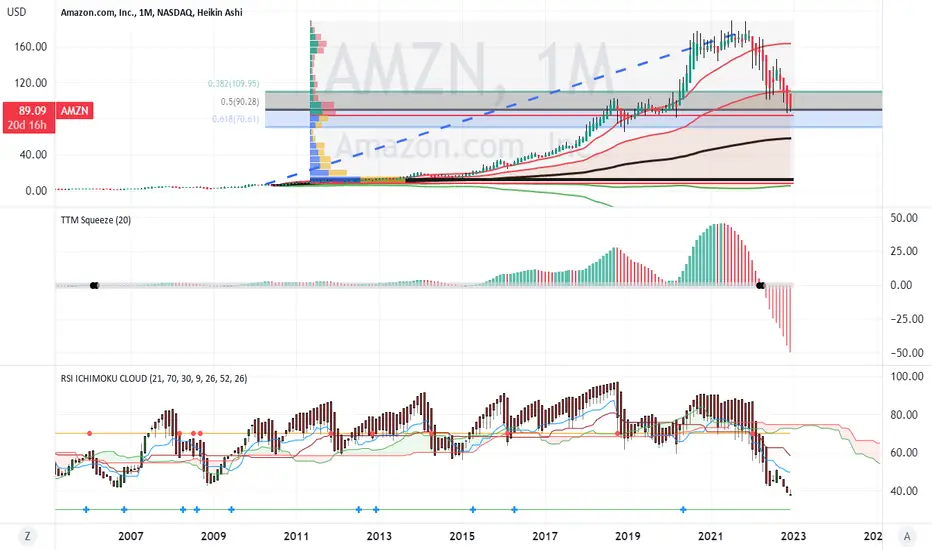
Om a monthly chart from Amazon's beginning to the present.
Amazon was in a sustained uptrend peaking in the summer of 2021.
Since then it has retraced down to the Fib 0.5 level. Price
was more than two standard deviations above the long term
anchored VWAP and is now downtrending into a value area.
The volume profile shows three high volume nodes and price
is currently in the middle node, Finally, the volatility on the
RSI indicator has decreased as had the strength itself.
AMZN is likely setting up for a reversal. Now, is a good time
to buy stock or a long term call option. This is a long idea
for investors not traders.
Amazon was in a sustained uptrend peaking in the summer of 2021.
Since then it has retraced down to the Fib 0.5 level. Price
was more than two standard deviations above the long term
anchored VWAP and is now downtrending into a value area.
The volume profile shows three high volume nodes and price
is currently in the middle node, Finally, the volatility on the
RSI indicator has decreased as had the strength itself.
AMZN is likely setting up for a reversal. Now, is a good time
to buy stock or a long term call option. This is a long idea
for investors not traders.

免責聲明
這些資訊和出版物並非旨在提供,也不構成TradingView提供或認可的任何形式的財務、投資、交易或其他類型的建議或推薦。請閱讀使用條款以了解更多資訊。
免責聲明
這些資訊和出版物並非旨在提供,也不構成TradingView提供或認可的任何形式的財務、投資、交易或其他類型的建議或推薦。請閱讀使用條款以了解更多資訊。