
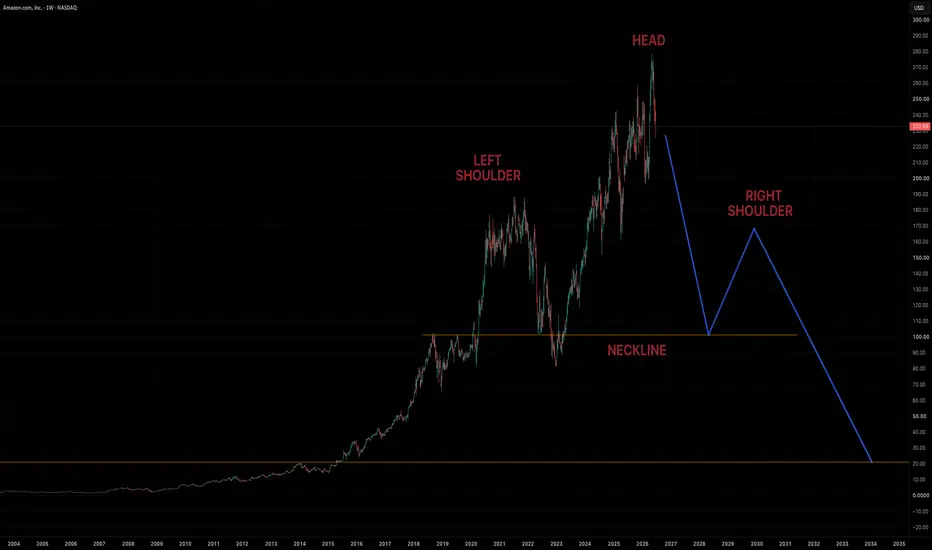
Amazon... potential macro Head & Shoulders pattern setup. This crash is gonna get ugly...
U.S. stock market valuation indicators:
Buffett Indicator: 2026: ~236% (2000 peak: ~145%; 2008 peak: ~110%)
Price-to-Sales: 2026: ~3.6x (2000 peak: ~2.1x; 2008 peak: ~1.5x)
Profit Margins: 2026: ~13.4% (2000 peak: ~8%; 2008 peak: ~7%)
Price-to-Book: 2026: ~5.8x (2000 peak: ~5x; 2008 peak: ~3x)
U.S. stock market valuation indicators:
Buffett Indicator: 2026: ~236% (2000 peak: ~145%; 2008 peak: ~110%)
Price-to-Sales: 2026: ~3.6x (2000 peak: ~2.1x; 2008 peak: ~1.5x)
Profit Margins: 2026: ~13.4% (2000 peak: ~8%; 2008 peak: ~7%)
Price-to-Book: 2026: ~5.8x (2000 peak: ~5x; 2008 peak: ~3x)

免責聲明
這些資訊和出版物並非旨在提供,也不構成TradingView提供或認可的任何形式的財務、投資、交易或其他類型的建議或推薦。請閱讀使用條款以了解更多資訊。
免責聲明
這些資訊和出版物並非旨在提供,也不構成TradingView提供或認可的任何形式的財務、投資、交易或其他類型的建議或推薦。請閱讀使用條款以了解更多資訊。