
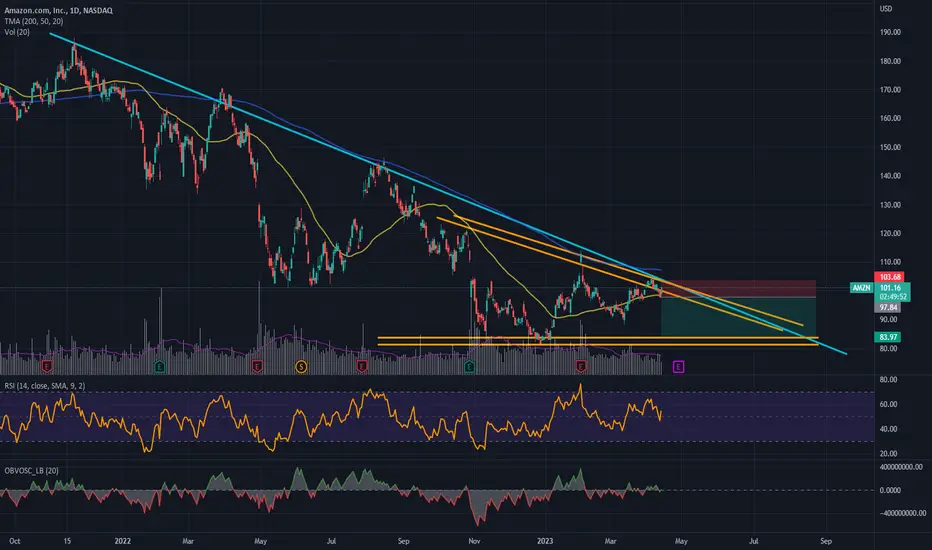
- Price below the 200 MA, confirming the general downtrend.
- Possible formation of descending triangle.
- Demand for the asset is weakening (see volume, RSI and OBV indicators).
When the price cuts below the 50 MA, the RSI is well below 50% and the OBV is red and well below the mid level, enter short. I prefer to enter my positions with confirmations of indicators, rather formations of patterns.
WARNING: THIS IS NOT A INVESTMENT ADVICE. I'M JUST POSTING MY IDEAS AND IT IS FOR EXCHANGE OPINIONS.

免責聲明
這些資訊和出版物並非旨在提供,也不構成TradingView提供或認可的任何形式的財務、投資、交易或其他類型的建議或推薦。請閱讀使用條款以了解更多資訊。
免責聲明
這些資訊和出版物並非旨在提供,也不構成TradingView提供或認可的任何形式的財務、投資、交易或其他類型的建議或推薦。請閱讀使用條款以了解更多資訊。