
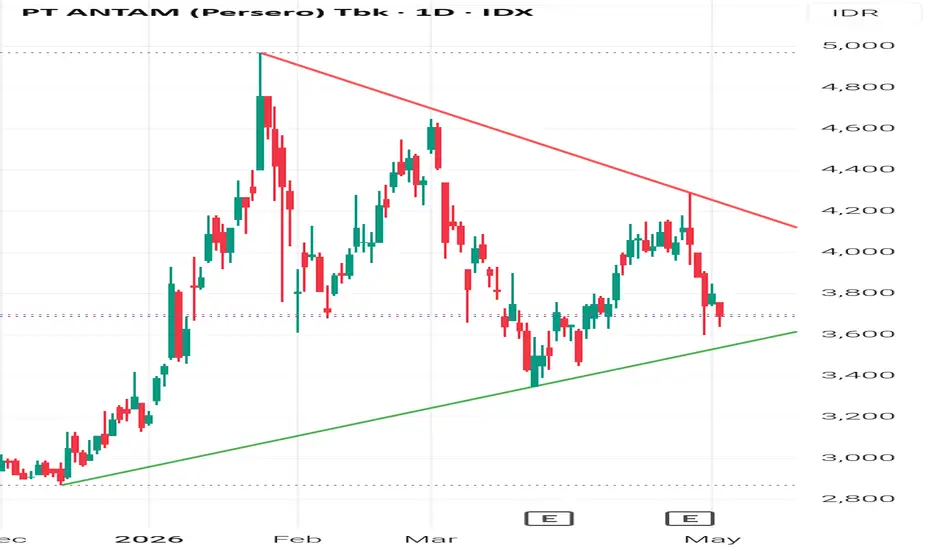
ANTM is currently forming a compression structure between a descending resistance (red trendline) and an ascending support (green trendline), indicating a potential symmetrical triangle pattern.
Price is now approaching the apex zone, which typically leads to a breakout move.
🔍 Key Observations:
Lower highs → bearish pressure from sellers
Higher lows → buyers still defending support
Price hovering around key horizontal level (~3,600–3,700)
Volatility is decreasing → breakout incoming
📈 Bullish Scenario:
Break and close above 4,100 – 4,200
Confirmation with strong bullish candle & volume
Potential targets: 4,400 → 4,700
📉 Bearish Scenario:
Breakdown below 3,600 support
Opens downside toward 3,300 → 3,000 area
⚠️ Strategy:
Wait for clear breakout + retest confirmation
Avoid entering inside the triangle (fakeout risk is high)
Use tight risk management
💡 Conclusion: ANTM is in a decision phase. A breakout from this structure will likely determine the next major trend direction.
Price is now approaching the apex zone, which typically leads to a breakout move.
🔍 Key Observations:
Lower highs → bearish pressure from sellers
Higher lows → buyers still defending support
Price hovering around key horizontal level (~3,600–3,700)
Volatility is decreasing → breakout incoming
📈 Bullish Scenario:
Break and close above 4,100 – 4,200
Confirmation with strong bullish candle & volume
Potential targets: 4,400 → 4,700
📉 Bearish Scenario:
Breakdown below 3,600 support
Opens downside toward 3,300 → 3,000 area
⚠️ Strategy:
Wait for clear breakout + retest confirmation
Avoid entering inside the triangle (fakeout risk is high)
Use tight risk management
💡 Conclusion: ANTM is in a decision phase. A breakout from this structure will likely determine the next major trend direction.

免責聲明
這些資訊和出版物並非旨在提供,也不構成TradingView提供或認可的任何形式的財務、投資、交易或其他類型的建議或推薦。請閱讀使用條款以了解更多資訊。