
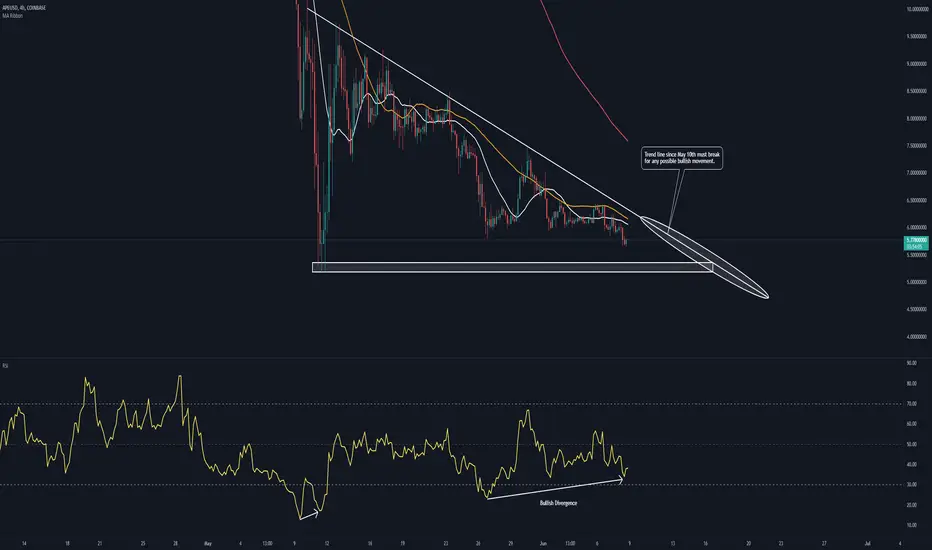
On the 4H chart (and other timeframes), we can see bullish divergence forming where the price action is heading lower and the RSI is making higher lows. This could be a sign of a small reversal coming soon.
Currently, the 4H 50MA (orange line) is acting as resistance, so if we get above that, that would be a good start for a move up.
Support is at $5.20. A break below would invalidate this idea.
Currently, the 4H 50MA (orange line) is acting as resistance, so if we get above that, that would be a good start for a move up.
Support is at $5.20. A break below would invalidate this idea.

免責聲明
這些資訊和出版物並非旨在提供,也不構成TradingView提供或認可的任何形式的財務、投資、交易或其他類型的建議或推薦。請閱讀使用條款以了解更多資訊。
免責聲明
這些資訊和出版物並非旨在提供,也不構成TradingView提供或認可的任何形式的財務、投資、交易或其他類型的建議或推薦。請閱讀使用條款以了解更多資訊。