已更新
APHA Rising Wedge on Hourly Uptrend
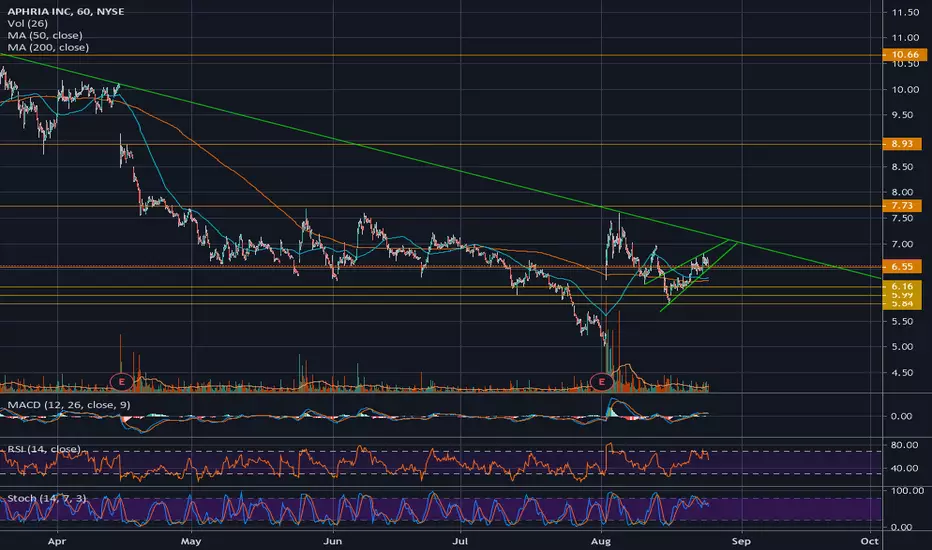
Rising wedge pattern on the hourly chart. Daily indicators show possible underlying strength, but hourly volume is decreasing. Broader markets could see a bounce on Monday, and APHA is likely to participate, but chances are very small that it'll break this pattern bullish.
Trade with caution.
Trade with caution.
註釋
As expected, a bearish confirmation of this rising wedge pattern. Now we are looking at a descending triangle on the daily charts, another bearish pattern, indicating that APHA may want to close the bull gap before reaching for new highs. It makes sense, to expect buyers to wait there, patiently. Seems like a great level to get in for a long position - $5.20ish.註釋
Correction - $5.40ish
🅱🄰🆁🅺🆆🄾🆁🆃🅷
theBarkworthyNotes.com
theBarkworthyNotes.com
免責聲明
這些資訊和出版物並非旨在提供,也不構成TradingView提供或認可的任何形式的財務、投資、交易或其他類型的建議或推薦。請閱讀使用條款以了解更多資訊。
🅱🄰🆁🅺🆆🄾🆁🆃🅷
theBarkworthyNotes.com
theBarkworthyNotes.com
免責聲明
這些資訊和出版物並非旨在提供,也不構成TradingView提供或認可的任何形式的財務、投資、交易或其他類型的建議或推薦。請閱讀使用條款以了解更多資訊。