
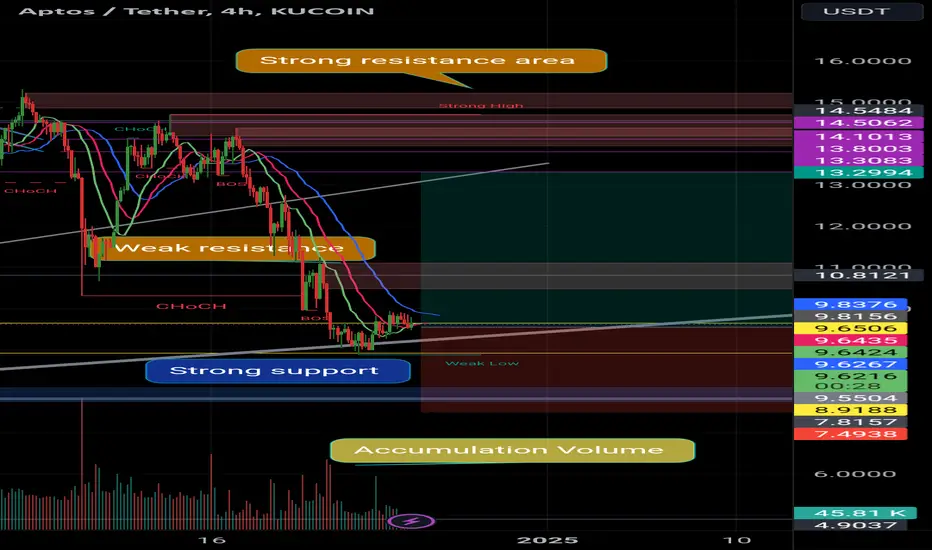
Apt usdt Daily analysis
Time frame 4hours
Risk rewards ratio >1.8 👈👌
Technical analysis 👇
After a correction, ApTuS is gathering energy to start an upward movement.🕰🕰
The price has fallen to the gray uptrend line.
This gray line, which acts as a support, as well as another support level marked in dark blue on the chart, have created very strong support.
According to Elliott Wave Analysis, the three-point Elliott wave pattern has ended and we are now ready to start the impulse waves.
The volume chart gives us signs that an accumulation is forming in this area.
We conclude that, considering the three factors mentioned above,
1. The price is in a strong support area,
2. The Elliott wave correction has ended, and 3. Volume chart shows an accumulation area
👇👇👇👇
Based on this, we conclude that the right point and time for a price will increase and good Risk rewards ratio ~2 for traders 👌
Time frame 4hours
Risk rewards ratio >1.8 👈👌
Technical analysis 👇
After a correction, ApTuS is gathering energy to start an upward movement.🕰🕰
The price has fallen to the gray uptrend line.
This gray line, which acts as a support, as well as another support level marked in dark blue on the chart, have created very strong support.
According to Elliott Wave Analysis, the three-point Elliott wave pattern has ended and we are now ready to start the impulse waves.
The volume chart gives us signs that an accumulation is forming in this area.
We conclude that, considering the three factors mentioned above,
1. The price is in a strong support area,
2. The Elliott wave correction has ended, and 3. Volume chart shows an accumulation area
👇👇👇👇
Based on this, we conclude that the right point and time for a price will increase and good Risk rewards ratio ~2 for traders 👌
交易進行
註釋
on the way手動結束交易
hit LS
免責聲明
這些資訊和出版物並非旨在提供,也不構成TradingView提供或認可的任何形式的財務、投資、交易或其他類型的建議或推薦。請閱讀使用條款以了解更多資訊。
免責聲明
這些資訊和出版物並非旨在提供,也不構成TradingView提供或認可的任何形式的財務、投資、交易或其他類型的建議或推薦。請閱讀使用條款以了解更多資訊。