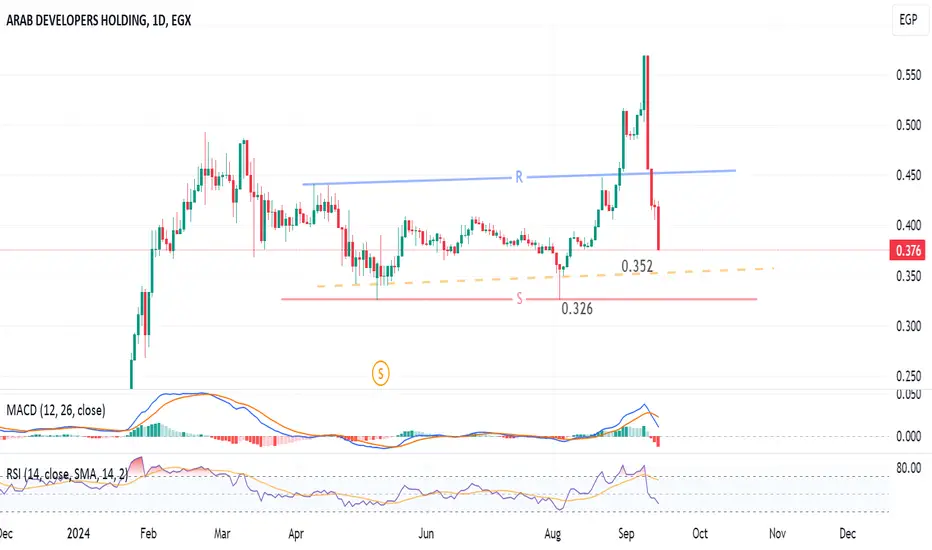
Daily chart, the stock  ARAB has been falling badly. The pattern is showing a possibility for 2 rebound levels: 0.352 and 0.326
Technical indicators:
RSI is near a BUY zone.
MACD is signalling a down movement.
So, a new entry should be after the clear rebound.
Be careful with this stock!
ARAB has been falling badly. The pattern is showing a possibility for 2 rebound levels: 0.352 and 0.326Technical indicators:
RSI is near a BUY zone.
MACD is signalling a down movement.
So, a new entry should be after the clear rebound.
Be careful with this stock!

免責聲明
這些資訊和出版物並非旨在提供,也不構成TradingView提供或認可的任何形式的財務、投資、交易或其他類型的建議或推薦。請閱讀使用條款以了解更多資訊。