做多
Unclear ARDR direction
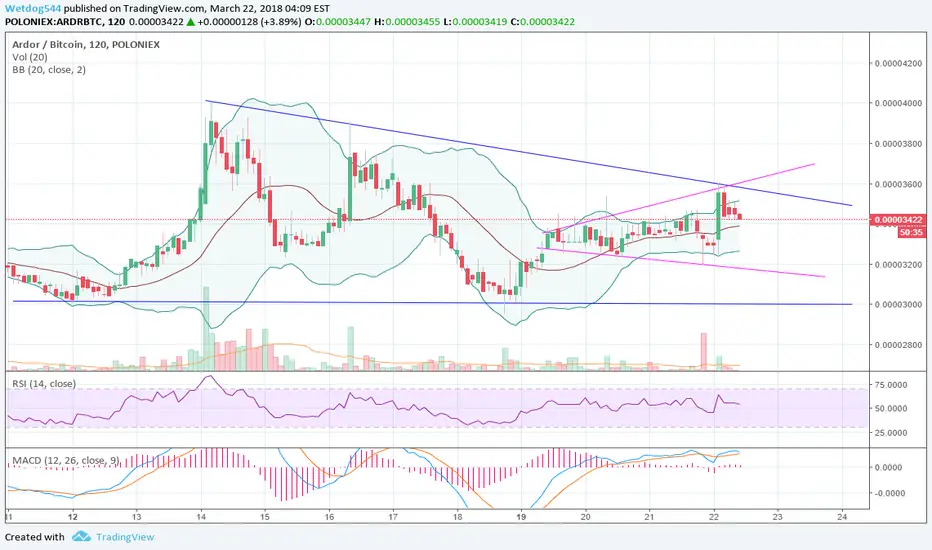
Like many of the Altcoins ARDR has been in a long slow decline. The bottom support of 0.0000300 BTC have been tested a couple of times and seem to hold. During the last four days ARDR have forming a Symmetrical Broadening Wedge which is an indication of increasing price volatility but no indication of direction as these wedges can go up or down. The Bollinger Bands are tightening which indicates there is price movement on the way. The upper resistance have been touched four times. The MACD shows an upward trend. The RSI is staying above the 50 line.
Most of the indicators are positive but low volumes will likely see a drop to around the 0.000032 BTC level by the end of the weekend and then a slow climb and possible breakout around 30 May. Suggest a wait and see approach before making any ARDR decisions.
As always do your homework and make your own investment decisions.

免責聲明
這些資訊和出版物並非旨在提供,也不構成TradingView提供或認可的任何形式的財務、投資、交易或其他類型的建議或推薦。請閱讀使用條款以了解更多資訊。