
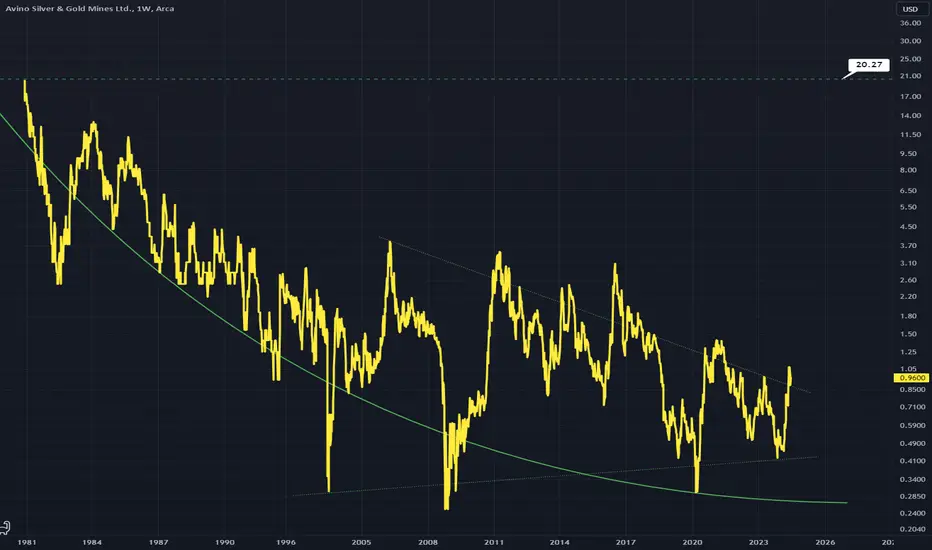
The descending curve is a bullish chart pattern called a descending scallop
Higher lows are also present within the triangle I have drawn
The breakout on this would be pretty aggressive and probably reach right back up to its starting point.
Looks like a crypto chart lol.
Weekly Chart.
Higher lows are also present within the triangle I have drawn
The breakout on this would be pretty aggressive and probably reach right back up to its starting point.
Looks like a crypto chart lol.
Weekly Chart.

免責聲明
這些資訊和出版物並非旨在提供,也不構成TradingView提供或認可的任何形式的財務、投資、交易或其他類型的建議或推薦。請閱讀使用條款以了解更多資訊。