
TREND
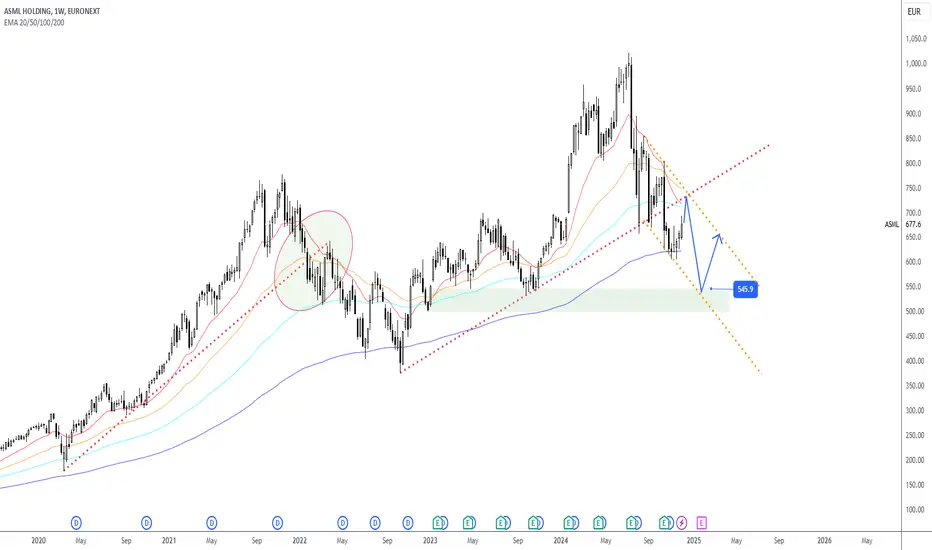
According to the current wave structure, it is in the downtrend.
Characteristically, it is used to create pull and push backs after support/resistance breakout.
So we can expect similar behavior now.
It has not formed a channel yet, but a probable channel can be estimated as on the chart.
Moving Averages
The current price is under 100-day (Turquoise) (so supports downtrend)
50-day (Orange) will most likely cross 100-day (Turquoise) from up to down (powerful indicator supporting downtrend) in two weeks, unless prices exceeds 50-day.
200-day (Blue) has just worked as a support, but the next momentum is expected to be more powerful resulting a potential breakout of 200-day support.
SUMMARY
Based on this analysis, a price action following the blue arrow is highly probable.
交易進行

免責聲明
這些資訊和出版物並非旨在提供,也不構成TradingView提供或認可的任何形式的財務、投資、交易或其他類型的建議或推薦。請閱讀使用條款以了解更多資訊。