
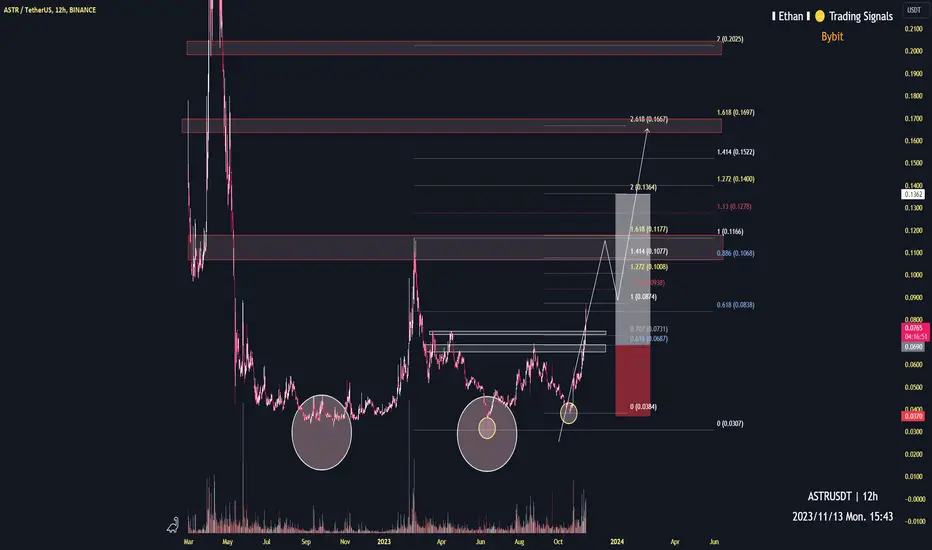
12h time frame
-
ASTR is creating two double bottoms, white and yellow circles which are marked on chart. This is a strong sign of bottom structure. Combining Fibonacci Projection with Structural resistance, we can have three targets as below. However, considering the potential dump of market, ASTR might reach 0.1~0.12 only then pull back with whole market, but we can still expect higher target when bull coming in 2024.
TP: 0.1~0.12 / 0.166 / 0.2
SL: 0.037

免責聲明
這些資訊和出版物並非旨在提供,也不構成TradingView提供或認可的任何形式的財務、投資、交易或其他類型的建議或推薦。請閱讀使用條款以了解更多資訊。