
#ATLAS/USD
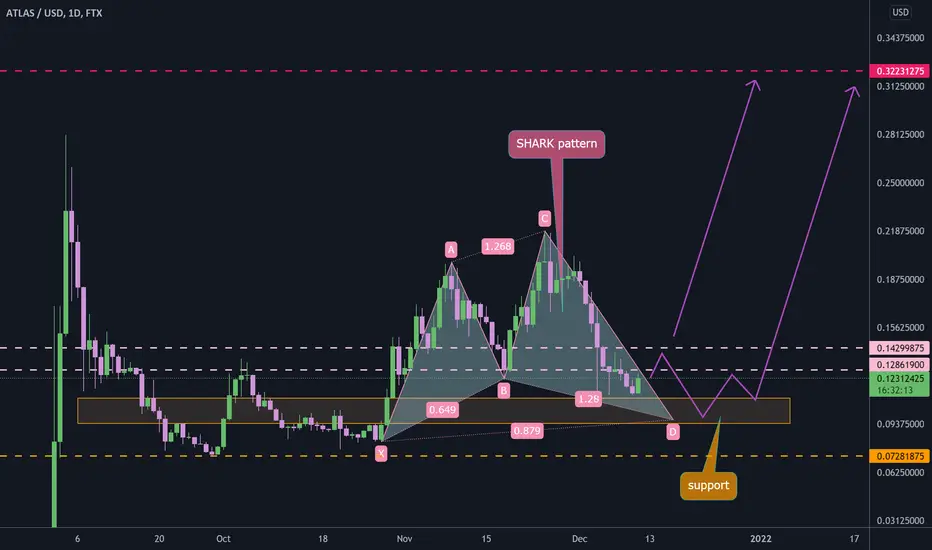
 ATLAS shaped a Shark pattern that can complete around $0.096.
so price of this #metaverse token may have more drop to that price and may not, breaking out from $0.143 can cause pump to $0.32.
and if price break down from support zone, next support is around $0.072.
ATLAS shaped a Shark pattern that can complete around $0.096.so price of this #metaverse token may have more drop to that price and may not, breaking out from $0.143 can cause pump to $0.32.
and if price break down from support zone, next support is around $0.072.
註釋
#ATLAS/USDT
ATLAS is at support zone that is the same with descending support line.as we can see divergence between price and RSI, price can head up to resistance zone between $0.998 and $0.1117, that is the same with descending trend lines.
break out from this resistance can increase price to next resistance around $0.1286.
rejection from resistance zone can drop price to support around $0.0728.
break below descending support will invalid this analysis.

免責聲明
這些資訊和出版物並非旨在提供,也不構成TradingView提供或認可的任何形式的財務、投資、交易或其他類型的建議或推薦。請閱讀使用條款以了解更多資訊。