
Hi All,
I have come across ATOM\COSMOS and have not payed enough attention to it, as it should and hence this post. (F chart)
Continuing on with the Gem series base on my previous posts, basically calling out charts that over performed, given parabolic curves.
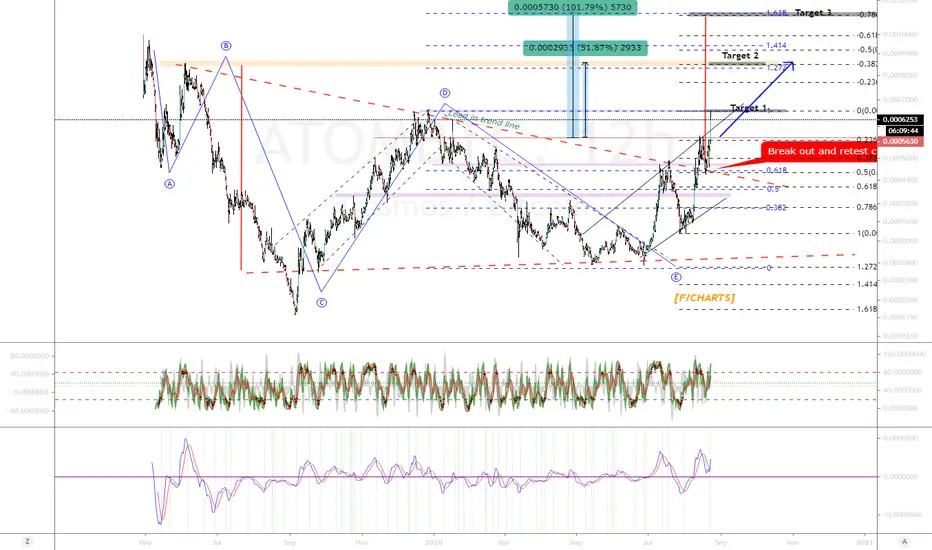
Atom with its pairing has given us a beautiful structure it is which fits perfect into Corrective Wave triangle patterns, along with Bump and Run (BARR) strategy.
Having said that, this structure is easy to read and the targets are easier than others to identify.
Since its hit my 1st target (although I don't have Atom), Target 2 is clear and Target 3 as well, which has confluence with the BARR approach and fib extensions levels.
Using the height descending, top declining, bottom flat triangle, Target 3 is deduced.
How to trade this?
BTC is still feeling out the 11500 range and its my opinion that it won't hold, and hence ATOM\BTC will do a pullback from its 1st target, to the described red line (chart below), maybe even lower.
That's the time to enter and go long.

Please give me a tick or like for this post.
Cheers,
S.Sari
Overview of structure and targets: BTC pairing

ATOM/USDT

I have come across ATOM\COSMOS and have not payed enough attention to it, as it should and hence this post. (F chart)
Continuing on with the Gem series base on my previous posts, basically calling out charts that over performed, given parabolic curves.
Atom with its pairing has given us a beautiful structure it is which fits perfect into Corrective Wave triangle patterns, along with Bump and Run (BARR) strategy.
Having said that, this structure is easy to read and the targets are easier than others to identify.
Since its hit my 1st target (although I don't have Atom), Target 2 is clear and Target 3 as well, which has confluence with the BARR approach and fib extensions levels.
Using the height descending, top declining, bottom flat triangle, Target 3 is deduced.
How to trade this?
BTC is still feeling out the 11500 range and its my opinion that it won't hold, and hence ATOM\BTC will do a pullback from its 1st target, to the described red line (chart below), maybe even lower.
That's the time to enter and go long.
Please give me a tick or like for this post.
Cheers,
S.Sari
Overview of structure and targets: BTC pairing
ATOM/USDT
註釋
註釋
If it pulls back, I'm ready to jump in more.註釋
註釋
The 12 hr chart is good to work with註釋
註釋
交易結束:目標達成
It just goes to show you, I need more work in getting the target right.Looking at this chart, it also shows you that Atom drops hard against bitcoin once again. I'm closing this as I have been stopped out with good profit.
This current level looks right but we just can't assume.
註釋

Discord: discord.com/invite/vb4hbP88vb (TradeToProspa)
Telegram: t.me/TprospaTradersbot
This community has signals now but with no risk management comms.
Telegram: t.me/TprospaTradersbot
This community has signals now but with no risk management comms.
相關出版品
免責聲明
這些資訊和出版物並非旨在提供,也不構成TradingView提供或認可的任何形式的財務、投資、交易或其他類型的建議或推薦。請閱讀使用條款以了解更多資訊。
Discord: discord.com/invite/vb4hbP88vb (TradeToProspa)
Telegram: t.me/TprospaTradersbot
This community has signals now but with no risk management comms.
Telegram: t.me/TprospaTradersbot
This community has signals now but with no risk management comms.
相關出版品
免責聲明
這些資訊和出版物並非旨在提供,也不構成TradingView提供或認可的任何形式的財務、投資、交易或其他類型的建議或推薦。請閱讀使用條款以了解更多資訊。