
Hello everyone, today i'm going analysis ATOM/USDT on Daily time frame.
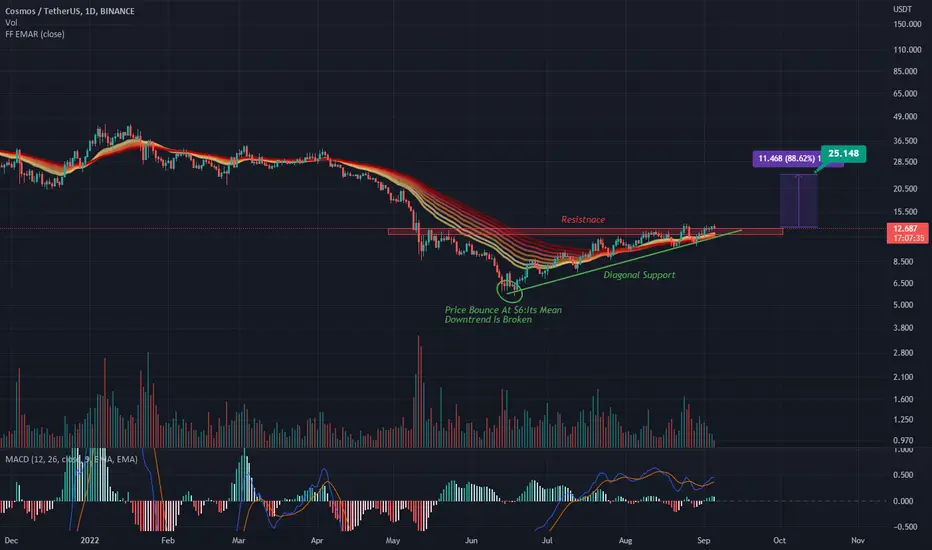
1)First we can clearly see ATOM strong Bounce from $6 to $12, its mean Downtrend is broken and now we are Uptrend cycle.
2)In chart we formed Ascending Triangle pattern,we have diagonal Support line and horizontal Resistance level at $12 approximately.
3)Now price squeezing in Ascending Triangle and price can breakout from $12 at any moment,so for clear breakout price must close behind Ascending Triangle approximately at $15 with good Volume.
4)We also will using Ribbon trend indicator,we can clearly see price above Ribbon line its mean we are now in momentum.
5)MACD oscillator is above Histogram 0 line its Bullish and also we have Bullish cross.
i'm will happy if this analysis will help you

免責聲明
這些資訊和出版物並非旨在提供,也不構成TradingView提供或認可的任何形式的財務、投資、交易或其他類型的建議或推薦。請閱讀使用條款以了解更多資訊。
免責聲明
這些資訊和出版物並非旨在提供,也不構成TradingView提供或認可的任何形式的財務、投資、交易或其他類型的建議或推薦。請閱讀使用條款以了解更多資訊。