

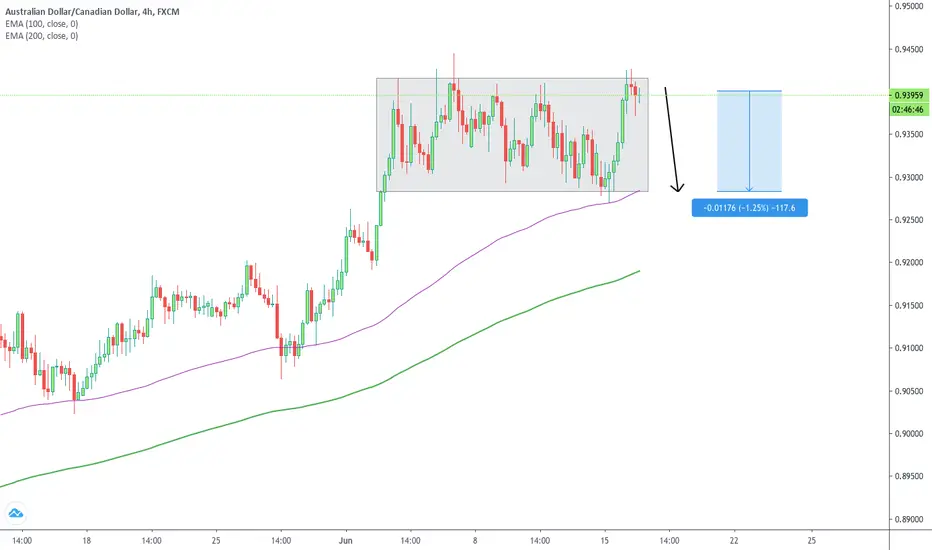
H4 analysis on AUDCAD shows price ranging between the 0.94000 - 0.93000 psychological levels since the beginning of the month.
Price action at the resistance area (long wicks, spinning tops/dojis) indicates price is struggling to break higher.
100+ pip drop potential, targeting the bottom of the range, in line with the 100 EMA where price may reject.
Price action at the resistance area (long wicks, spinning tops/dojis) indicates price is struggling to break higher.
100+ pip drop potential, targeting the bottom of the range, in line with the 100 EMA where price may reject.

免責聲明
這些資訊和出版物並非旨在提供,也不構成TradingView提供或認可的任何形式的財務、投資、交易或其他類型的建議或推薦。請閱讀使用條款以了解更多資訊。