

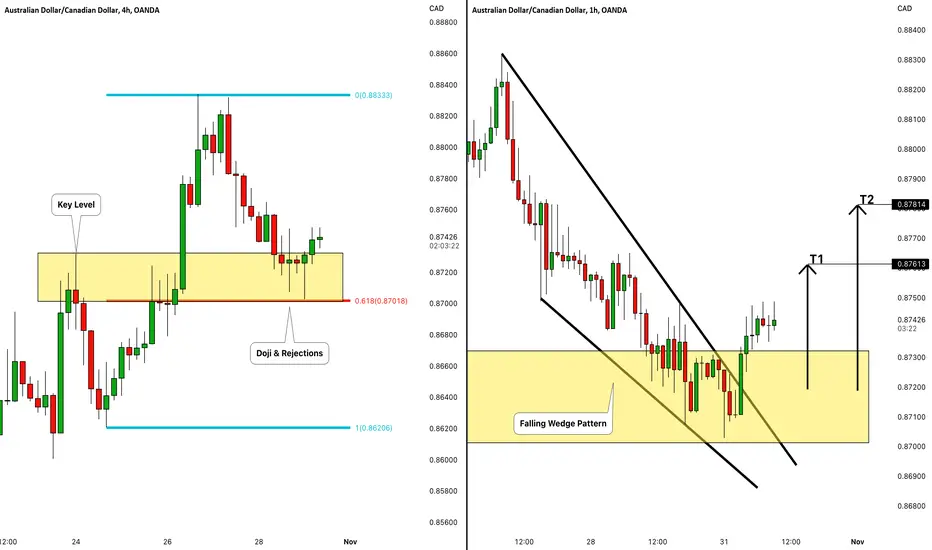
AUDCAD dropped to an important confluence zone last week.
The underlined yellow area is based on the intersection between 618 retracement of the last bullish impulse
and a horizontal intraday demand zone.
The market formed a doji candle on that and was nicely rejected.
On an hourly time frame, I spotted a confirmed breakout of a resistance line of a falling wedge pattern.
I believe that the pair may bounce soon.
Targets: 0.876 / 0.878
❤️If you have any questions, please, ask me in the comment section.
Please, support my work with like, thank you!❤️

✅My Telegram Channel: t.me/VasilyTrading
❗️YouTube Channel: youtube.com/c/VasilyTrader
✅ Facebook: facebook.com/VasilyTrading/
⭐ Get 100% Deposit Bonus: bit.ly/bestforexgoldbroker
❗️YouTube Channel: youtube.com/c/VasilyTrader
✅ Facebook: facebook.com/VasilyTrading/
⭐ Get 100% Deposit Bonus: bit.ly/bestforexgoldbroker
相關出版品
免責聲明
這些資訊和出版物並非旨在提供,也不構成TradingView提供或認可的任何形式的財務、投資、交易或其他類型的建議或推薦。請閱讀使用條款以了解更多資訊。