

📌 Overview
---------------------------------------------------------------
📘 Definition
---------------------------------------------------------------
📌 Key Points
---------------------------------------------------------------
📊 Chart Explanation
---------------------------------------------------------------
📉 Summary
---------------------------------------------------------------
💡 Why It Matters
---------------------------------------------------------------
📌 Conclusion
---------------------------------------------------------------
⚠️ Disclaimer
Elliott Wave Theory is a method of technical analysis developed by Ralph Nelson Elliott. The theory suggests that financial markets move in repetitive wave patterns driven by crowd psychology and investor sentiment. These recurring patterns help traders understand market cycles, trend development, and corrective phases within price action.
---------------------------------------------------------------
📘 Definition
Elliott Wave Theory states that markets move in recognizable wave structures that reflect the collective emotions of market participants.
A complete market cycle generally consists of:
[\*] Impulse Waves (1-2-3-4-5) – Five waves moving in the direction of the primary trend.
[\*] Corrective Waves (A-B-C) – Three waves moving against the prevailing trend.
[\*] Market Cycle – The complete sequence of an impulse phase followed by a corrective phase.
[\*] Crowd Psychology – Market movements influenced by optimism, fear, greed, and uncertainty.
[\*] Wave Structure – The recurring pattern that forms trends and corrections across all timeframes.
[\*] Fractal Nature – Elliott Wave patterns can appear within larger and smaller wave structures.
---------------------------------------------------------------
📌 Key Points
• Markets move in waves rather than straight lines.
• A complete cycle consists of 5 impulse waves and 3 corrective waves.
• Impulse waves move with the trend.
• Corrective waves move against the trend.
• Wave patterns reflect crowd psychology and market sentiment.
• Elliott Wave structures can be found on all timeframes.
• The theory helps traders understand where price may be within a market cycle.
---------------------------------------------------------------
📊 Chart Explanation
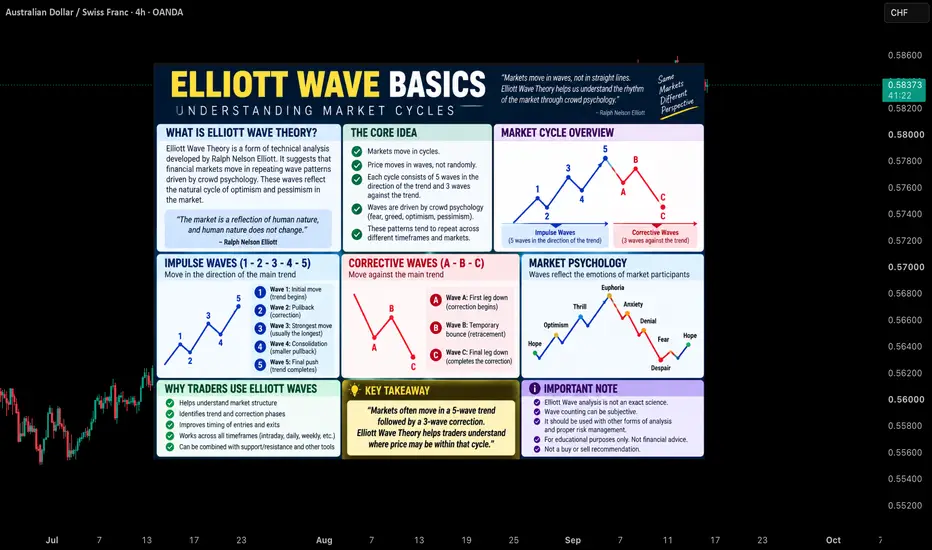
• The chart illustrates a complete Elliott Wave market cycle.
• Waves 1, 3, and 5 represent the primary trend movement and are known as Impulse Waves.
• Waves 2 and 4 represent temporary pullbacks within the larger trend.
• After the completion of Wave 5, the market typically enters a corrective phase labeled A-B-C.
• Wave A begins the correction, Wave B forms a temporary retracement, and Wave C completes the corrective structure.
• The diagram also highlights how market psychology evolves throughout the cycle, from optimism and confidence to fear and uncertainty.
• The example is an educational illustration designed to explain the basic concepts of Elliott Wave Theory.
---------------------------------------------------------------
📉 Summary
Elliott Wave Theory provides a structured framework for understanding market cycles. The theory proposes that markets often progress through a five-wave trend phase followed by a three-wave corrective phase. Recognizing these patterns can help traders better interpret market structure and price behavior.
---------------------------------------------------------------
💡 Why It Matters
• Helps traders understand overall market structure.
• Provides insight into trend and correction phases.
• Improves awareness of crowd psychology.
• Assists in identifying potential stages of a market cycle.
• Can be combined with support, resistance, trendlines, and other technical tools.
• Builds a foundation for more advanced Elliott Wave analysis.
---------------------------------------------------------------
📌 Conclusion
Elliott Wave Theory remains one of the most widely recognized market cycle models in technical analysis. By understanding the relationship between impulse waves, corrective waves, and crowd psychology, traders can develop a deeper understanding of how markets often move through recurring cycles.
---------------------------------------------------------------
⚠️ Disclaimer
📘 For educational purposes only.
🙅 Not SEBI registered.
❌ Not a buy/sell recommendation.
🧠 Purely a learning resource.
📊 Not Financial Advice.

Pine Script Developer • Market Analysis
免責聲明
這些資訊和出版物並非旨在提供,也不構成TradingView提供或認可的任何形式的財務、投資、交易或其他類型的建議或推薦。請閱讀使用條款以了解更多資訊。
Pine Script Developer • Market Analysis
免責聲明
這些資訊和出版物並非旨在提供,也不構成TradingView提供或認可的任何形式的財務、投資、交易或其他類型的建議或推薦。請閱讀使用條款以了解更多資訊。