

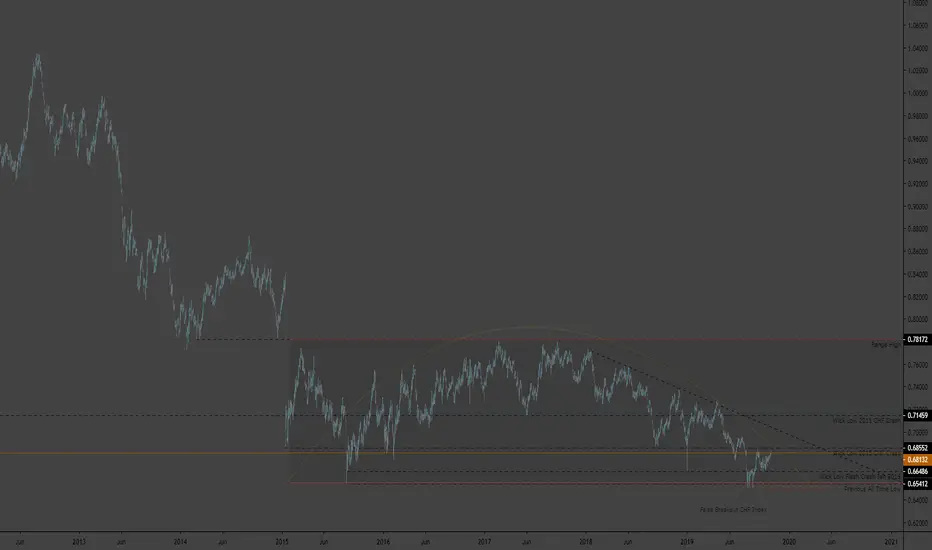
AUDCHF approaching resistance on the daily chart. Some key support resistance levels marked on the chart.
This pair has been in downtrend since September 2018.
The pair took a quick look below the previous all time low from back in 2015, which created a false break out.
The lower wick from 2015 flash crash looks to be holding as resistance.
1 hour chart looks like we just broke below support.
This pair has been in downtrend since September 2018.
The pair took a quick look below the previous all time low from back in 2015, which created a false break out.
The lower wick from 2015 flash crash looks to be holding as resistance.
1 hour chart looks like we just broke below support.
註釋
Close up view of 1 hour chart
免責聲明
這些資訊和出版物並非旨在提供,也不構成TradingView提供或認可的任何形式的財務、投資、交易或其他類型的建議或推薦。請閱讀使用條款以了解更多資訊。