

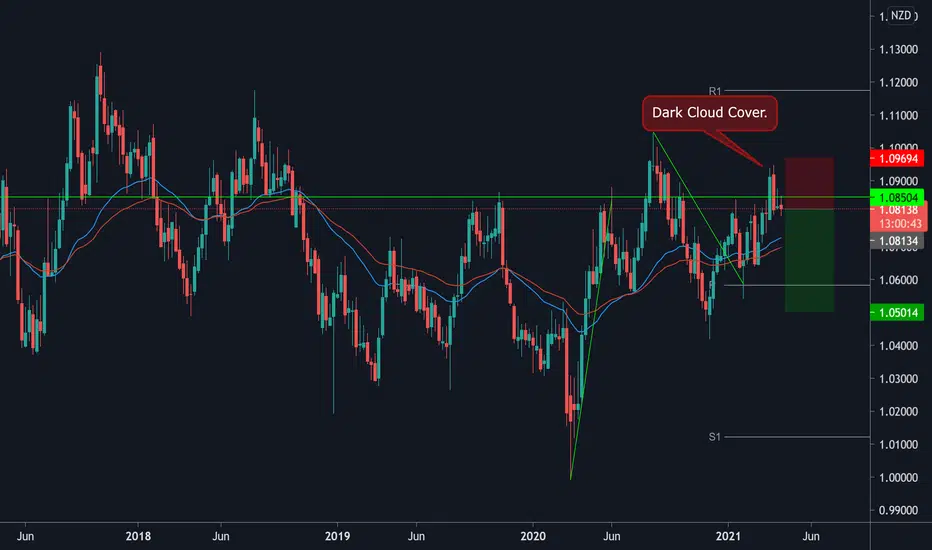
This is a weekly chart with price making a "dark cloud cover" pattern, that's what it's called.
Weekly chart, we have seen the 50% fib retracement already, 2:1 looks like a tight one, but good for a bounce atleast, I would assume.
1% Risk. 2:1RR
Weekly chart, we have seen the 50% fib retracement already, 2:1 looks like a tight one, but good for a bounce atleast, I would assume.
1% Risk. 2:1RR
交易進行
70 pips into profit. Let's see what the coming days offer.交易進行
Took a little while, it was a weekly chart after all. Off we go!交易進行
It's a weekly chart! takes some time.手動結束交易
There you go, trading a weekly chart.. took...surprisingly.. weeks.
免責聲明
這些資訊和出版物並非旨在提供,也不構成TradingView提供或認可的任何形式的財務、投資、交易或其他類型的建議或推薦。請閱讀使用條款以了解更多資訊。
免責聲明
這些資訊和出版物並非旨在提供,也不構成TradingView提供或認可的任何形式的財務、投資、交易或其他類型的建議或推薦。請閱讀使用條款以了解更多資訊。