

Overview
⸻⸻⸻⸻⸻⸻⸻⸻⸻⸻⸻
Concept
A Rounding Top develops when price slowly shifts from buying dominance to selling pressure. Instead of a sharp reversal, the market forms a smooth curved structure that reflects gradual distribution by market participants.
⸻⸻⸻⸻⸻⸻⸻⸻⸻⸻⸻
Chart Explanation
⸻⸻⸻⸻⸻⸻⸻⸻⸻⸻⸻
Observation
⸻⸻⸻⸻⸻⸻⸻⸻⸻⸻⸻
Summary
⸻⸻⸻⸻⸻⸻⸻⸻⸻⸻⸻
Disclaimer
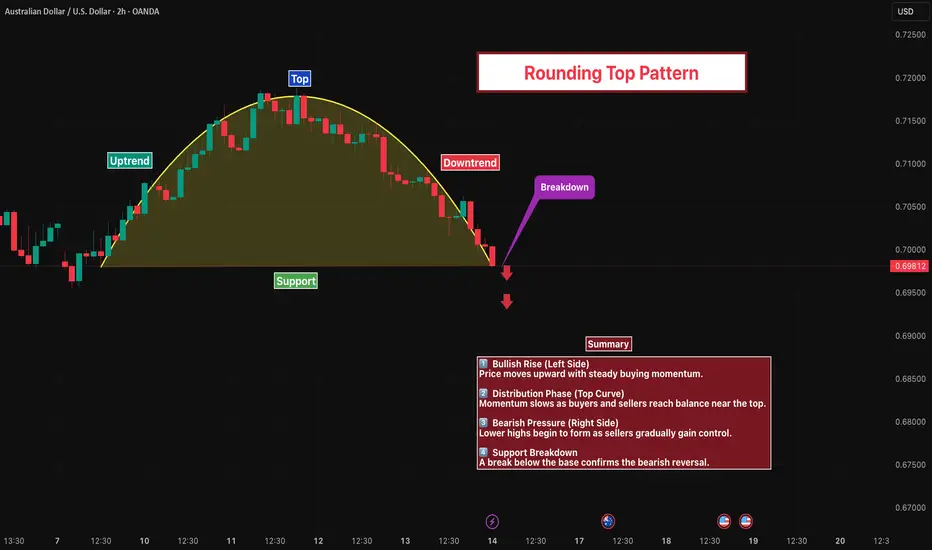
The chart shows a Rounding Top formation, a classic bearish reversal pattern where bullish momentum gradually fades and the market transitions from an uptrend to a downtrend.
⸻⸻⸻⸻⸻⸻⸻⸻⸻⸻⸻
Concept
A Rounding Top develops when price slowly shifts from buying dominance to selling pressure. Instead of a sharp reversal, the market forms a smooth curved structure that reflects gradual distribution by market participants.
⸻⸻⸻⸻⸻⸻⸻⸻⸻⸻⸻
Chart Explanation
1. Uptrend Formation – Price initially moves upward with steady buying momentum.
2. Top Formation – The market begins to slow down near the peak, forming a rounded structure.
3. Distribution Phase – Buyers and sellers reach temporary balance while momentum weakens.
4. Bearish Pressure – Lower highs start to appear, indicating increasing selling pressure.
5. Support Breakdown – Price breaks below the key support level, confirming the bearish reversal.
⸻⸻⸻⸻⸻⸻⸻⸻⸻⸻⸻
Observation
The rounded structure reflects a transition phase where bullish strength weakens and sellers gradually take control of the market.
⸻⸻⸻⸻⸻⸻⸻⸻⸻⸻⸻
Summary
The breakdown below support confirms the Rounding Top pattern and suggests a potential continuation of the downward move as selling pressure increases.
⸻⸻⸻⸻⸻⸻⸻⸻⸻⸻⸻
Disclaimer
📘 For educational purposes only.
🙅 Not SEBI registered.
❌ Not a buy/sell recommendation.
🧠 Purely a learning resource.
📊 Not Financial Advice.

Pine Script Developer • Market Analysis
免責聲明
這些資訊和出版物並非旨在提供,也不構成TradingView提供或認可的任何形式的財務、投資、交易或其他類型的建議或推薦。請閱讀使用條款以了解更多資訊。
Pine Script Developer • Market Analysis
免責聲明
這些資訊和出版物並非旨在提供,也不構成TradingView提供或認可的任何形式的財務、投資、交易或其他類型的建議或推薦。請閱讀使用條款以了解更多資訊。