

Whats up guys,
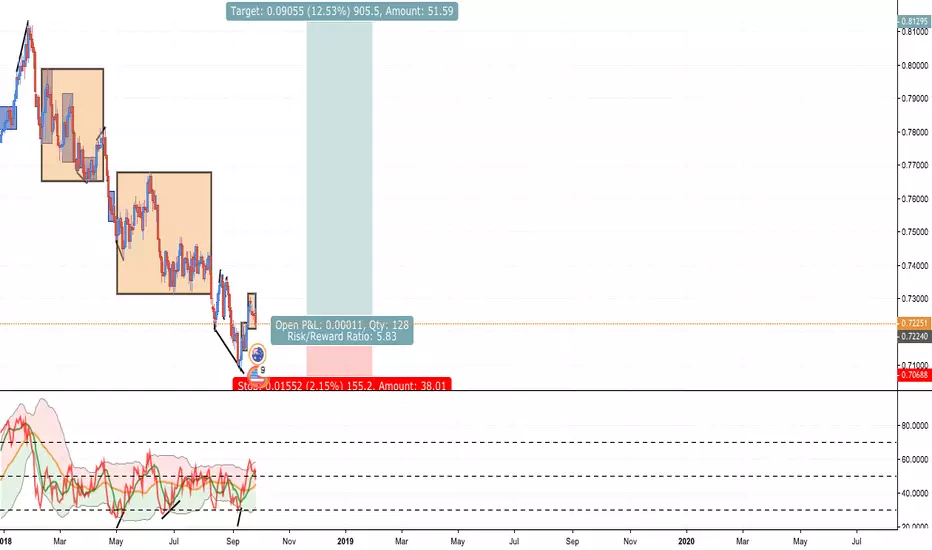
we are looking at the AUDUSD pair for a real long term buy. On the Daily chart we see two correction waves marked as yellow boxes. On the downside there is a divergence formed and price strongly retraced from the lowest point with a huge bullish daily candle. I just traded this two weeks ago but got stopped out. Now we are in a much better shape right now with these candlesticks patterns down there. We are waiting for a lower timer frame confirmation for a good entry. Price should at least go up to the 0.5 fib level.
Tomorrow i will upload a lower time frame update on this one, were we can clearly see how the pattern work on different time frames hand in hand.
Stay tuned...
we are looking at the AUDUSD pair for a real long term buy. On the Daily chart we see two correction waves marked as yellow boxes. On the downside there is a divergence formed and price strongly retraced from the lowest point with a huge bullish daily candle. I just traded this two weeks ago but got stopped out. Now we are in a much better shape right now with these candlesticks patterns down there. We are waiting for a lower timer frame confirmation for a good entry. Price should at least go up to the 0.5 fib level.
Tomorrow i will upload a lower time frame update on this one, were we can clearly see how the pattern work on different time frames hand in hand.
Stay tuned...
交易結束:達到停損點
Trade moved against its structure. SL hit註釋
Updated
免責聲明
這些資訊和出版物並非旨在提供,也不構成TradingView提供或認可的任何形式的財務、投資、交易或其他類型的建議或推薦。請閱讀使用條款以了解更多資訊。