
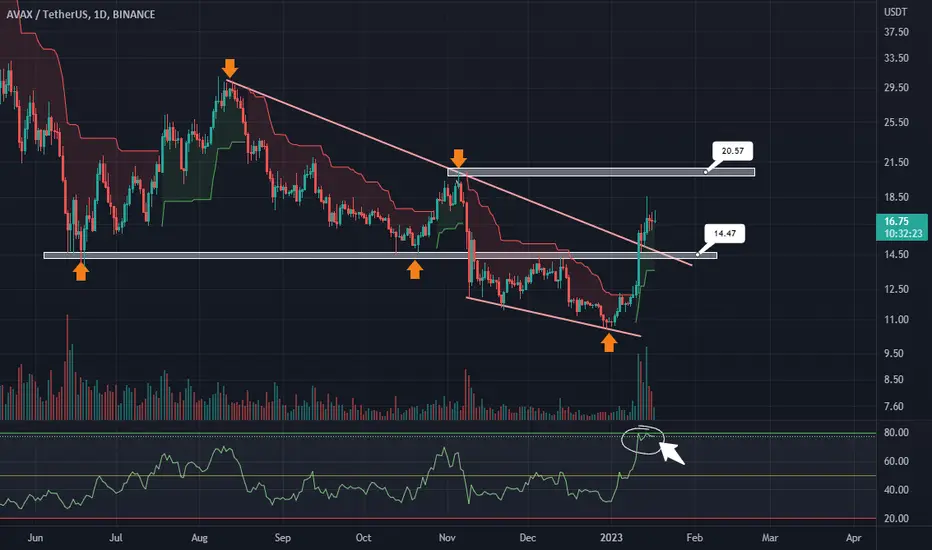
Here we can the daily chart of "AVAXUSDT" it has a horizontal SUPPORT at "14.47" and a horizontal RESISTANCE at "20.57". As we can see the candle already has taken breakout from the trendline with a high volume and if the candle retests the support zone then we can definetly look for a long opportunity from that zone and can expect a terget of "20.57" till then keep an eye on the support zone. And you can also see that the chart is making a double bottom and the pattern gets complete ot the resistance "20.57". Make trade ENTRY at the "14.47" zone with a TIGHT STOPLOSS at "13.90" and the TARGET ZONE at "20.57".
ENJOY !!!
ENJOY !!!

免責聲明
這些資訊和出版物並非旨在提供,也不構成TradingView提供或認可的任何形式的財務、投資、交易或其他類型的建議或推薦。請閱讀使用條款以了解更多資訊。
免責聲明
這些資訊和出版物並非旨在提供,也不構成TradingView提供或認可的任何形式的財務、投資、交易或其他類型的建議或推薦。請閱讀使用條款以了解更多資訊。