
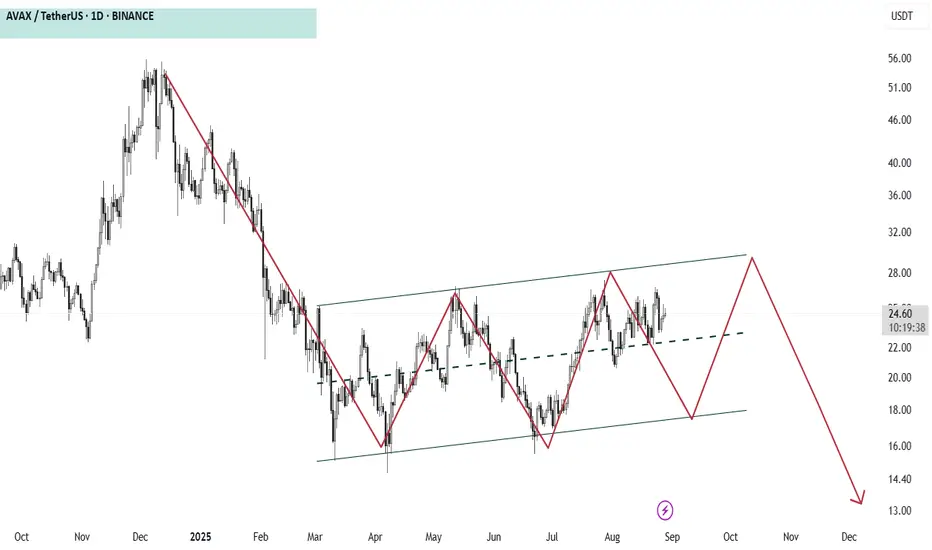
The chart of AVAX/USDT shows a rising channel that has been forming since March 2025. Price is moving up and down inside this channel, making lower highs and higher lows in a zig-zag pattern.
The projection suggests that after testing the upper side of the channel near $28, the price may fall back to the lower boundary around $18, and eventually break down towards $13–14.
This pattern indicates that while the market is still respecting the channel for now, the overall expectation is a bearish breakout in the medium term.
What do you think ?
The projection suggests that after testing the upper side of the channel near $28, the price may fall back to the lower boundary around $18, and eventually break down towards $13–14.
This pattern indicates that while the market is still respecting the channel for now, the overall expectation is a bearish breakout in the medium term.
What do you think ?

免責聲明
這些資訊和出版物並非旨在提供,也不構成TradingView提供或認可的任何形式的財務、投資、交易或其他類型的建議或推薦。請閱讀使用條款以了解更多資訊。