
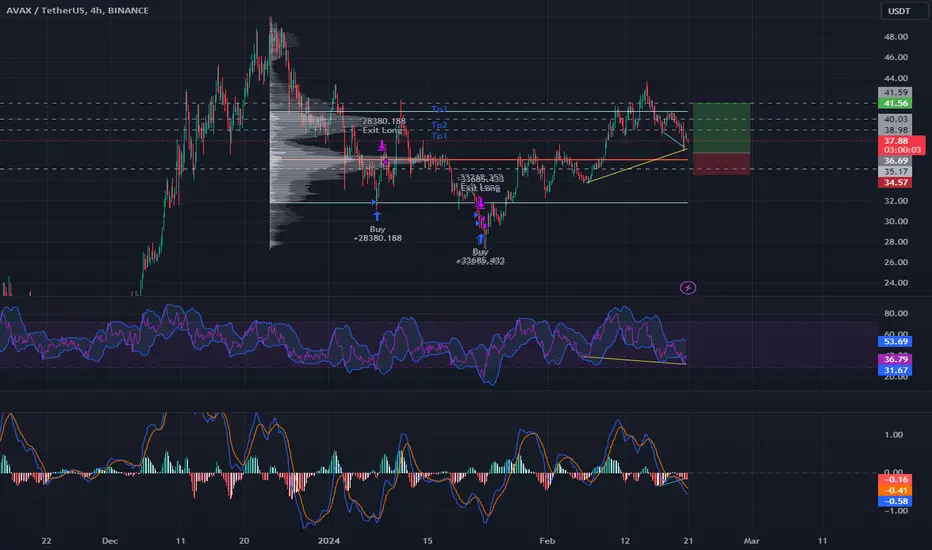
Analysis:
RSI Bullish Divergence (Yellow): The Relative Strength Index (RSI) is showing a bullish divergence, indicating potential upward momentum.
MACD Bullish Divergence (Light Blue): The Moving Average Convergence Divergence (MACD) is also displaying a bullish divergence, supporting the bullish bias.
Price Approaching Point of Control (POC): The price is nearing the Point of Control (POC), suggesting potential support or a reversal point.
Volume Profile Analysis: Zones with higher volumes in the volume profile have been identified as TP1, TP2, and TP3.
Trade Plan:
Entry: Consider entering a long position as the price approaches the POC or at current levels, given the bullish divergences observed in the RSI and MACD.
Take Profit:
TP1: Set the first take-profit level at the zone of higher volume identified in the volume profile.
TP2: Place the second take-profit level at the next zone of higher volume in the volume profile.
TP3: Target the third take-profit level at the subsequent zone of higher volume.
Stop Loss: Set a stop-loss order below the recent swing low or a suitable support level to manage risk.
Risk Management: Ensure proper risk management by allocating an appropriate portion of your capital to this trade and adjusting position size accordingly.
Note: Always conduct thorough analysis and consider using additional technical indicators or confirmatory signals before executing any trades. Risk management is crucial to protect your capital in volatile markets.

免責聲明
這些資訊和出版物並非旨在提供,也不構成TradingView提供或認可的任何形式的財務、投資、交易或其他類型的建議或推薦。請閱讀使用條款以了解更多資訊。
免責聲明
這些資訊和出版物並非旨在提供,也不構成TradingView提供或認可的任何形式的財務、投資、交易或其他類型的建議或推薦。請閱讀使用條款以了解更多資訊。