
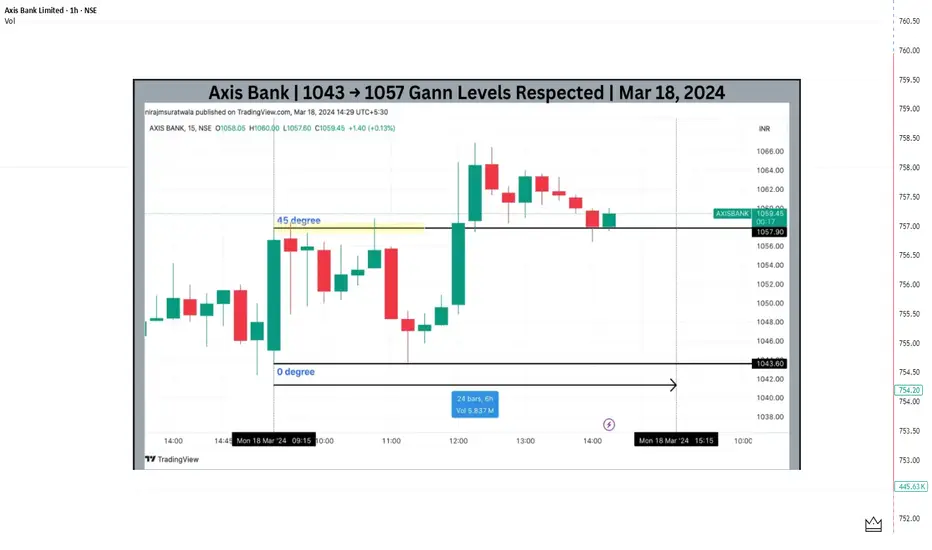
This idea presents an intraday case study showing how price reacted to a key Gann Square of 9 angle level. (Educational)
On 18 March 2024, Axis Bank showed strength from the first 15-minute candle.
The low of the first 15-minute candle near 1043 was used as the 0-degree reference, following WD Gann’s price–angle methodology.
Using Square of 9 calculations, the following level was derived:
45° level → 1057
Price reached the 45-degree level very early in the session (around 9:45 AM), much before the commonly observed time balance later in the day.
This early completion of price expansion indicated a price–time imbalance.
After testing the 45° zone, Axis Bank showed rejection and reversal, resulting in a clean intraday pullback from that level.
🔍 Key Observations
This example highlights how price, time, and angle alignment can be studied systematically in intraday trading.
Disclaimer:
This idea is shared strictly for educational and chart-analysis purposes only.
It does not represent trading advice or recommendations.
On 18 March 2024, Axis Bank showed strength from the first 15-minute candle.
The low of the first 15-minute candle near 1043 was used as the 0-degree reference, following WD Gann’s price–angle methodology.
Using Square of 9 calculations, the following level was derived:
45° level → 1057
Price reached the 45-degree level very early in the session (around 9:45 AM), much before the commonly observed time balance later in the day.
This early completion of price expansion indicated a price–time imbalance.
After testing the 45° zone, Axis Bank showed rejection and reversal, resulting in a clean intraday pullback from that level.
🔍 Key Observations
- Define the 0-degree base from early intraday structure
- Use 45° as normal price expansion
- Early arrival at angle levels can indicate exhaustion
- Gann geometry helps identify logical reaction zones, not guesses
This example highlights how price, time, and angle alignment can be studied systematically in intraday trading.
Disclaimer:
This idea is shared strictly for educational and chart-analysis purposes only.
It does not represent trading advice or recommendations.

相關出版品
免責聲明
這些資訊和出版物並非旨在提供,也不構成TradingView提供或認可的任何形式的財務、投資、交易或其他類型的建議或推薦。請閱讀使用條款以了解更多資訊。