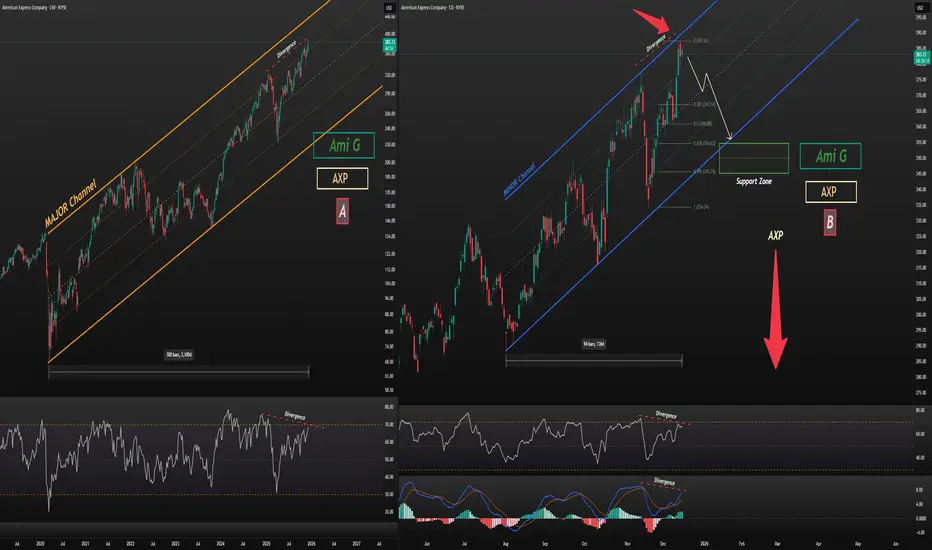
The stock is currently in a high-risk area for buying.
Chart A (Weekly): Price is near the upper boundary of its 5-year channel, accompanied by a clear RSI divergence.
Chart B (Daily): Price is at the top of its 5-month channel, while both MACD and RSI show strong divergences.
Based on these signals, this stock appears to be in a very risky buying zone, with a potential corrective move down to around $355.
This analysis will be updated as the situation develops.
Follow me on TradingView for more analyses and live stock trades.
 AXP
Chart A (Weekly): Price is near the upper boundary of its 5-year channel, accompanied by a clear RSI divergence.
Chart B (Daily): Price is at the top of its 5-month channel, while both MACD and RSI show strong divergences.
Based on these signals, this stock appears to be in a very risky buying zone, with a potential corrective move down to around $355.
This analysis will be updated as the situation develops.
Follow me on TradingView for more analyses and live stock trades.
AXP 交易結束:目標達成

AG-Precision-Trading
📈 Live Trading: Stocks & Crypto
🔍 Symbol Analysis & Insights
💎 Understanding Relative Asset Values
📈 Live Trading: Stocks & Crypto
🔍 Symbol Analysis & Insights
💎 Understanding Relative Asset Values
免責聲明
這些資訊和出版物並非旨在提供,也不構成TradingView提供或認可的任何形式的財務、投資、交易或其他類型的建議或推薦。請閱讀使用條款以了解更多資訊。
AG-Precision-Trading
📈 Live Trading: Stocks & Crypto
🔍 Symbol Analysis & Insights
💎 Understanding Relative Asset Values
📈 Live Trading: Stocks & Crypto
🔍 Symbol Analysis & Insights
💎 Understanding Relative Asset Values
免責聲明
這些資訊和出版物並非旨在提供,也不構成TradingView提供或認可的任何形式的財務、投資、交易或其他類型的建議或推薦。請閱讀使用條款以了解更多資訊。