
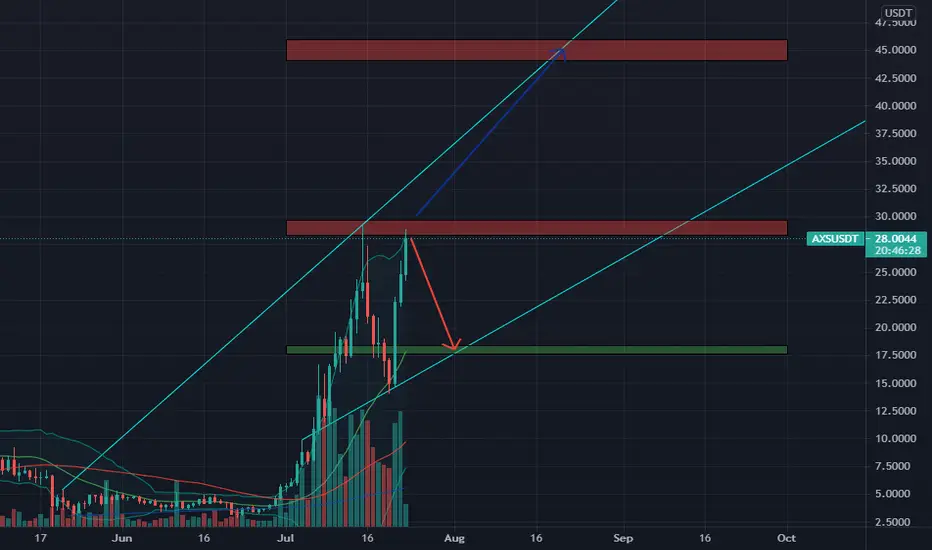
The buying volume of AXS is decreasing quite strongly at the area of $ 29 and this shows that there are not many people who want to buy AXS at this price range. If there is no buying here to help AXS break out of this $29 zone, it will fall sharply to the $18 zone in early August. However, as long as AXS conquers the $29 zone, it will also need some time. time before a sharp rise to the $45 zone in the second half of August
📈BUY
🔴Buy : 17.6-18.4$ if A. SL if B
📉SELL
🔴Sell : 28.3-29.7$ if B. SL if A
♻️BACK-UP
🔵Sell : 44-46$. SL if A
❓Details
🕯Timeframe : 1 Day
📈Red Arrow : Main Direction as BUY and SELL section
📉Blue Arrow : Back-Up Direction as BACK-UP section
🟩Green zone : Support zone as BUY section
🟥Red zone : Resistance zone as SELL section
🅰️A : The Close price of candlestick is Above the zone
🅱️B : The Close price of candlestick is Below the zone
📈BUY
🔴Buy : 17.6-18.4$ if A. SL if B
📉SELL
🔴Sell : 28.3-29.7$ if B. SL if A
♻️BACK-UP
🔵Sell : 44-46$. SL if A
❓Details
🕯Timeframe : 1 Day
📈Red Arrow : Main Direction as BUY and SELL section
📉Blue Arrow : Back-Up Direction as BACK-UP section
🟩Green zone : Support zone as BUY section
🟥Red zone : Resistance zone as SELL section
🅰️A : The Close price of candlestick is Above the zone
🅱️B : The Close price of candlestick is Below the zone

免責聲明
這些資訊和出版物並非旨在提供,也不構成TradingView提供或認可的任何形式的財務、投資、交易或其他類型的建議或推薦。請閱讀使用條款以了解更多資訊。
免責聲明
這些資訊和出版物並非旨在提供,也不構成TradingView提供或認可的任何形式的財務、投資、交易或其他類型的建議或推薦。請閱讀使用條款以了解更多資訊。