
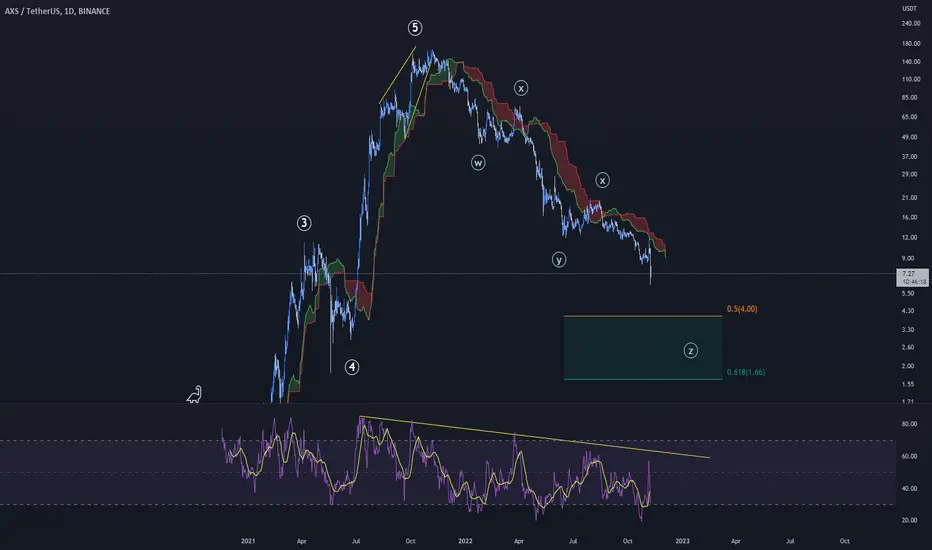
From the point of Elliott wave analysis, We can clearly see a downward trend from ATH, Which can have a final target in Wave Z in the specified Fibonacci Range.
Considering that the analysis is from a long-term point of view, as a result, the Fibonacci range is enlarged, but an experienced trader should look for reversal patterns to enter the trade by checking the price movement when reaching the Fibonacci area or near it.
Also If You can Manage your Risk, you can easily take short on this Time while reaching the Fibonacci Zone, and also it can Be a Great Short Position with +100% Profit with a moderate Leverage.
In the future, we will update this analysis as the price moves further.
Keep calm and follow the trend with me
Considering that the analysis is from a long-term point of view, as a result, the Fibonacci range is enlarged, but an experienced trader should look for reversal patterns to enter the trade by checking the price movement when reaching the Fibonacci area or near it.
Also If You can Manage your Risk, you can easily take short on this Time while reaching the Fibonacci Zone, and also it can Be a Great Short Position with +100% Profit with a moderate Leverage.
In the future, we will update this analysis as the price moves further.
Keep calm and follow the trend with me

免責聲明
這些資訊和出版物並非旨在提供,也不構成TradingView提供或認可的任何形式的財務、投資、交易或其他類型的建議或推薦。請閱讀使用條款以了解更多資訊。
免責聲明
這些資訊和出版物並非旨在提供,也不構成TradingView提供或認可的任何形式的財務、投資、交易或其他類型的建議或推薦。請閱讀使用條款以了解更多資訊。