
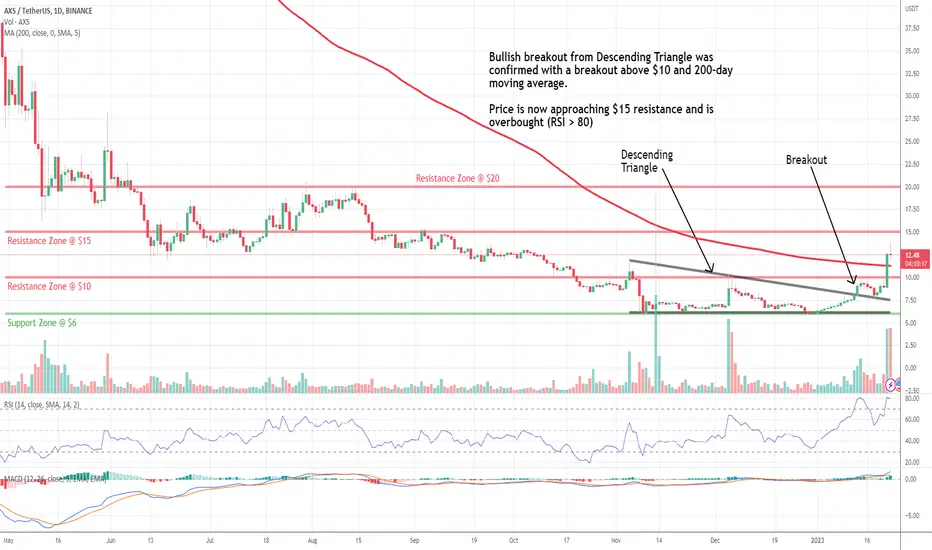
Axie Infinity (AXS) technical analysis:
Trade setup: Bullish breakout from Descending Triangle was confirmed with a breakout above $10 and 200-day moving average. Price is now approaching $15 resistance and is overbought (RSI > 80). The recent big move comes ahead of a negative catalyst in form of an upcoming token unlock.
Trend: Uptrend on Short- and Medium-Term basis and Downtrend on Long-Term basis.
Momentum is Bullish but extremely overbought. (MACD Line is above MACD Signal Line). RSI is bullish (> 55) but extremely overbought (> 80) which could imply that price could briefly pause or pull back if it reaches Resistance.
Support and Resistance: Nearest Support Zone is $6. The nearest Resistance Zone is $10, which it broke, then $15, and $20.

免責聲明
這些資訊和出版物並非旨在提供,也不構成TradingView提供或認可的任何形式的財務、投資、交易或其他類型的建議或推薦。請閱讀使用條款以了解更多資訊。