
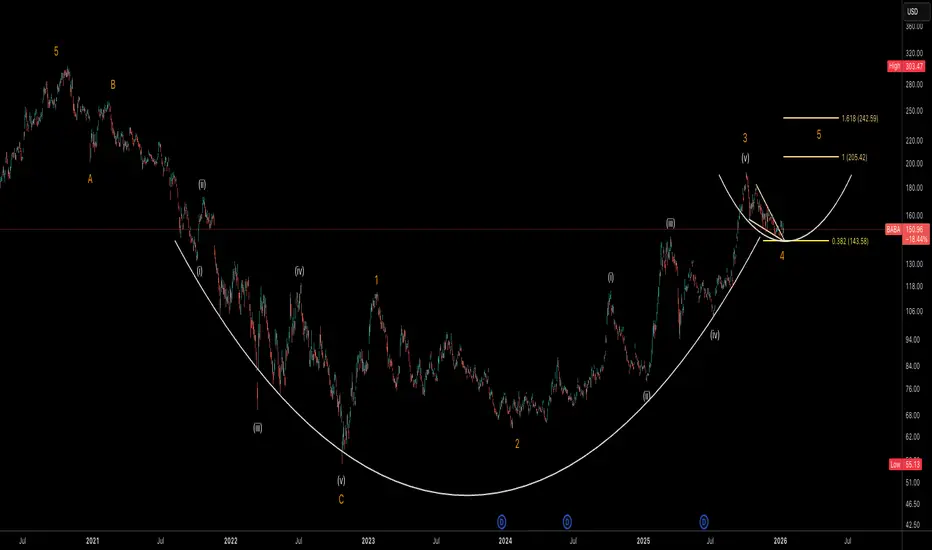
This chart for Alibaba (BABA) showcases a massive multi-year accumulation pattern, specifically a "Rounding Bottom" or "Cup" formation that began in late 2022. From an Elliott Wave perspective, the stock appears to have completed a primary Wave 3 impulse peak near the $190 level in late 2025 and is currently in the late stages of a Wave 4 corrective pullback.
The long-term outlook for BABA remains highly bullish as it successfully transitions from a multi-year basing phase into a structural uptrend. The recent pullback from the October 2025 highs represents a textbook Wave 4 correction, which has found precision support at the 0.382 Fibonacci retracement level ($143.58). This level aligns perfectly with the breakout point of the major rounding base, transforming old resistance into new support.
Key Technical Levels:
* Support Zone: The $143 - $150 area is critical; as long as the pivot at point 4 holds, the impulsive structure remains intact.
* Wave 5 Target 1: A 1.0 Fibonacci extension projects an initial target of $205.42, which would reclaim the 52-week highs.
* Wave 5 Target 2: The primary 1.618 extension sits at $242.59, aligning with major historical supply zones from early 2021.
* Invalidation: A sustained daily close below the Wave 2 low (approx. $70-$80) would invalidate this specific count, though the $143 level is the immediate "line in the sand" for bulls.
Projected Outlook:
The current price action at $150.96 is forming what looks like a bullish consolidation (handle) following the massive cup breakout. With cloud and AI demand accelerating revenue growth into 2026, the fundamental narrative supports a re-rating toward the $200+ consensus analyst targets. Traders should watch for a breakout above the Wave 3 peak to confirm the start of the final fifth-wave leg higher.
The long-term outlook for BABA remains highly bullish as it successfully transitions from a multi-year basing phase into a structural uptrend. The recent pullback from the October 2025 highs represents a textbook Wave 4 correction, which has found precision support at the 0.382 Fibonacci retracement level ($143.58). This level aligns perfectly with the breakout point of the major rounding base, transforming old resistance into new support.
Key Technical Levels:
* Support Zone: The $143 - $150 area is critical; as long as the pivot at point 4 holds, the impulsive structure remains intact.
* Wave 5 Target 1: A 1.0 Fibonacci extension projects an initial target of $205.42, which would reclaim the 52-week highs.
* Wave 5 Target 2: The primary 1.618 extension sits at $242.59, aligning with major historical supply zones from early 2021.
* Invalidation: A sustained daily close below the Wave 2 low (approx. $70-$80) would invalidate this specific count, though the $143 level is the immediate "line in the sand" for bulls.
Projected Outlook:
The current price action at $150.96 is forming what looks like a bullish consolidation (handle) following the massive cup breakout. With cloud and AI demand accelerating revenue growth into 2026, the fundamental narrative supports a re-rating toward the $200+ consensus analyst targets. Traders should watch for a breakout above the Wave 3 peak to confirm the start of the final fifth-wave leg higher.

免責聲明
這些資訊和出版物並非旨在提供,也不構成TradingView提供或認可的任何形式的財務、投資、交易或其他類型的建議或推薦。請閱讀使用條款以了解更多資訊。