
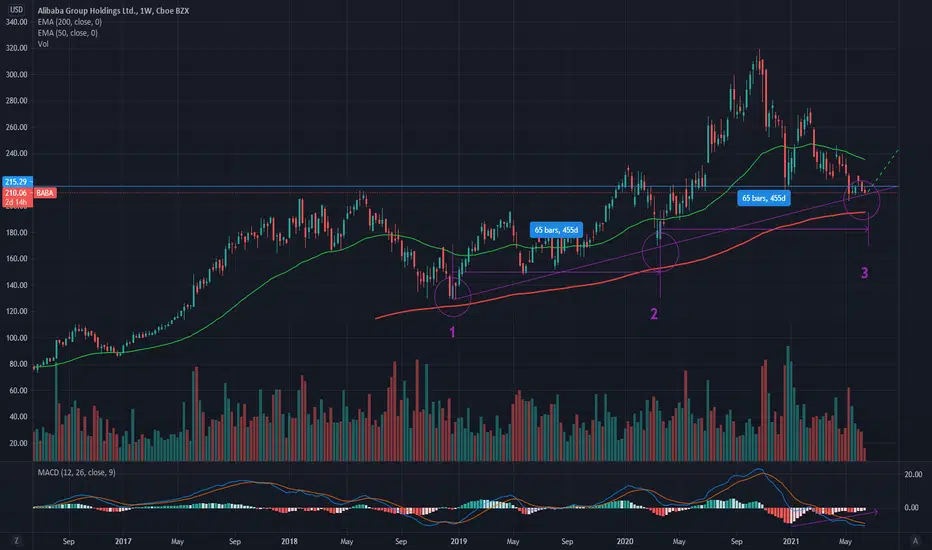
I am looking at BABA chart with MA200-day, MA50-day, MACD and Volume.
(Best to move chart to Week and Month to see clear MA proof)
It's interesting how BABA build candle over-and-over the green MA50.
I see 1-2-3 hits over the MA200 with upwards trend, looking for the date range,
we can see they're same numbers of days 455d/ 65bars.
I am looking forward to see a clear stock growth.
I am looking also to MACD and see an upwards trend.
(This is my way of thinking, please be carefully how you invest)
(Best to move chart to Week and Month to see clear MA proof)
It's interesting how BABA build candle over-and-over the green MA50.
I see 1-2-3 hits over the MA200 with upwards trend, looking for the date range,
we can see they're same numbers of days 455d/ 65bars.
I am looking forward to see a clear stock growth.
I am looking also to MACD and see an upwards trend.
(This is my way of thinking, please be carefully how you invest)

免責聲明
這些資訊和出版物並非旨在提供,也不構成TradingView提供或認可的任何形式的財務、投資、交易或其他類型的建議或推薦。請閱讀使用條款以了解更多資訊。