
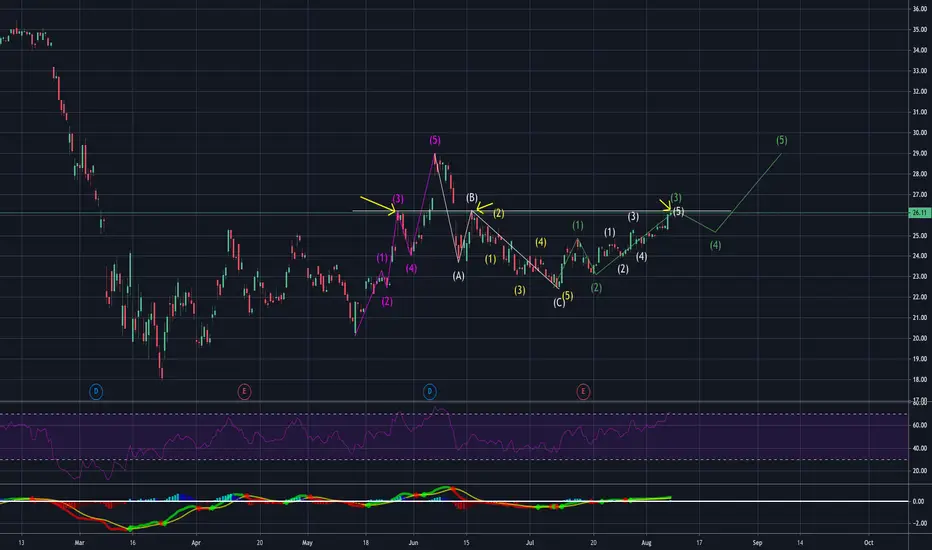
BAC looks to be riding Wave 3 Impulse with Extension right into strong Resistance. Could be a perfect spot for some consolidation into wave 4 before wave 5 looks to test the resistance. Conversely we could see a push through the resistance and then wave 4 will form and bounce off of the new support. Looking at wave 3 being an extension wave it is at it's 5th point and seems to me that any at this point would lead to wave 4.
- RSI is overbought on 4 hour chart (71) BUT only at 63 on the daily chart SO we could see a blow through of the resistance due to it still having room to move on the daily chart
- looking at the previous may-june wave setup it seems to be doing the same setup, wave 3 tests the resistance and then wave 5 blows through it
opposite: oversold and strong resistance could lead to breaking of the waves and bearish move
Lets see what happens. Happy to hear any critique/ideas on my setups or ideas, thanks!
- RSI is overbought on 4 hour chart (71) BUT only at 63 on the daily chart SO we could see a blow through of the resistance due to it still having room to move on the daily chart
- looking at the previous may-june wave setup it seems to be doing the same setup, wave 3 tests the resistance and then wave 5 blows through it
opposite: oversold and strong resistance could lead to breaking of the waves and bearish move
Lets see what happens. Happy to hear any critique/ideas on my setups or ideas, thanks!
註釋
Looks like wave 3 of BAC is continuing its upward trend. My estimate for wave 3 is now 161.8% fib which is $27.10 - this is only ~1% increase from current price. Wave 4 prediction low of ($25.55-26.21) based on fibonacci of wave 3 if it continues to $27 range. wave 5 prediction of $28.30 range.註釋
BAC wave 4 is testing 38.2 fib of wave 3 --> look to see if this holds up as wave 4's bottom
註釋
BAC broke through 38.2 Fib and is now sitting right at 50% of wave 3 right now (this is supposed to be the max correction of wave 4 according to EW)
RSI approaching overbought on 2 hour chart:
- 36.63 on 2 hour chart
- 46.16 on 4 hour chart
- 52.21 on daily chart
EMA: BAC is currently touching right on the 20 EMA on daily and 12 hour chart as well as almost hitting 50 EMA on 4hour chart
- looks like this could be a solid position for the corrective wave to reverse and begin wave 5
MACD: This is the indicator that troubles me on the daily and 12 hour chart but we will see how this plays out!
註釋
BAC is still bearish, broke the 50 fib. Looking to see the retrace to 61.8 fib/wave 1 price territory but there is also a bigger trend line that BAC is advancing towards. I am curious to see if it retraces all the way to test the trend line or will bounce before.

免責聲明
這些資訊和出版物並非旨在提供,也不構成TradingView提供或認可的任何形式的財務、投資、交易或其他類型的建議或推薦。請閱讀使用條款以了解更多資訊。
免責聲明
這些資訊和出版物並非旨在提供,也不構成TradingView提供或認可的任何形式的財務、投資、交易或其他類型的建議或推薦。請閱讀使用條款以了解更多資訊。