
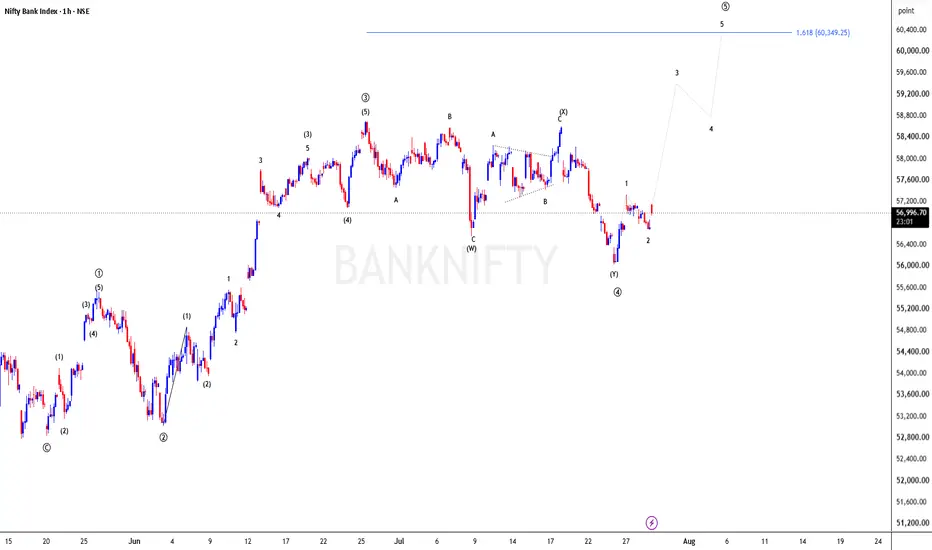
You can use this professional description for your chart:
---
## **BANKNIFTY 1H – Elliott Wave Analysis**
The chart suggests that **Bank Nifty has likely completed a corrective W-X-Y structure**, with wave **(Y)** forming near an important support zone. The recent decline appears to be exhausting, increasing the probability of a fresh impulsive advance.
The projected scenario indicates the beginning of a new **five-wave bullish impulse (1-2-3-4-5)**:
* **Wave 1:** Initial recovery from the (Y) low.
* **Wave 2:** A shallow pullback to confirm support.
* **Wave 3:** Expected to be the strongest and longest bullish wave, potentially breaking previous swing highs.
* **Wave 4:** Healthy correction after Wave 3.
* **Wave 5:** Final push toward the marked resistance zone (blue horizontal line), completing the impulsive cycle.
### **Key Observation**
* W-X-Y correction appears complete.
* Strong support has developed around the recent low.
* Bullish momentum is expected if price remains above the Wave (Y) low.
* A breakout above the recent swing highs would confirm the bullish Elliott Wave count.
**Trading Perspective:**
Maintain a bullish bias while price holds above the recent swing low. Confirmation of Wave 1 and Wave 2 increases the probability of an extended Wave 3 rally toward higher resistance levels.

免責聲明
這些資訊和出版物並非旨在提供,也不構成TradingView提供或認可的任何形式的財務、投資、交易或其他類型的建議或推薦。請閱讀使用條款以了解更多資訊。
免責聲明
這些資訊和出版物並非旨在提供,也不構成TradingView提供或認可的任何形式的財務、投資、交易或其他類型的建議或推薦。請閱讀使用條款以了解更多資訊。