
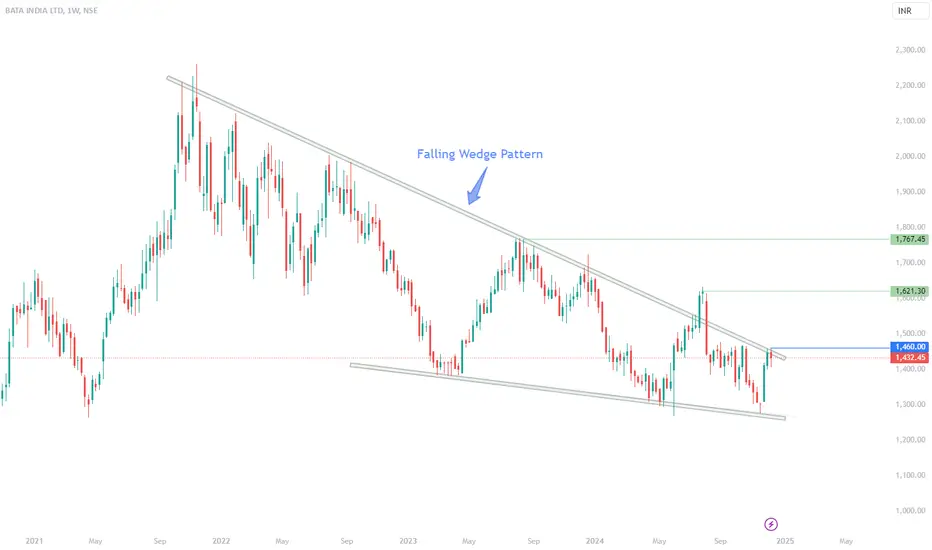
Weekly chart of BATA shows a beautiful Falling Wedge pattern.
The last candle is an inside candle from the previous week, suggesting a brief pause before the up move.
Any break above 1460 can result in a good move on the upside.
Fall below 1400 may be a continuation of the falling wedge pattern.
The last candle is an inside candle from the previous week, suggesting a brief pause before the up move.
Any break above 1460 can result in a good move on the upside.
Fall below 1400 may be a continuation of the falling wedge pattern.

免責聲明
這些資訊和出版物並非旨在提供,也不構成TradingView提供或認可的任何形式的財務、投資、交易或其他類型的建議或推薦。請閱讀使用條款以了解更多資訊。
免責聲明
這些資訊和出版物並非旨在提供,也不構成TradingView提供或認可的任何形式的財務、投資、交易或其他類型的建議或推薦。請閱讀使用條款以了解更多資訊。