
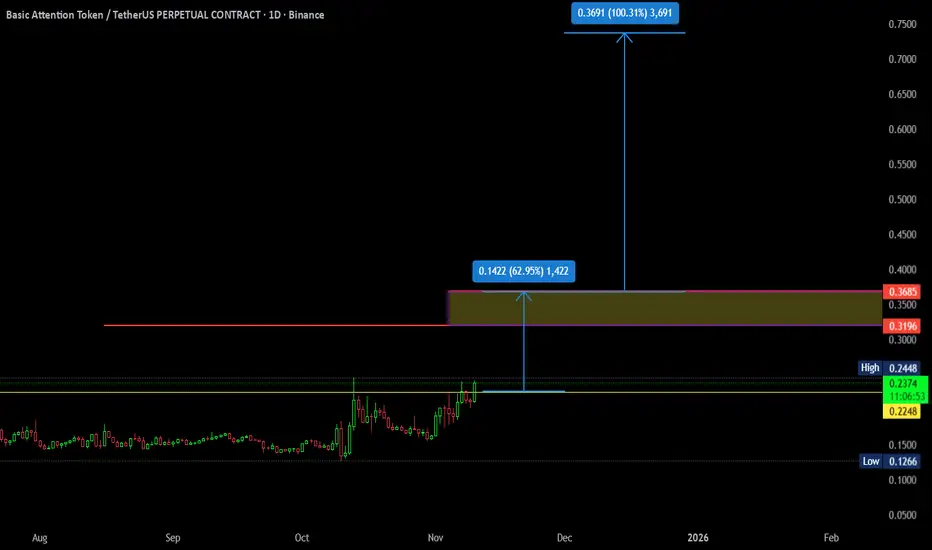
This analysis is based on VWAP (Volume Weighted Average Price) using monthly and daily charts.
Key Points:
- VWAP levels indicate significant support and resistance zones.
- The highlighted box represents the price expected on November 30 (note: November has 30 days, not 31).
- A daily close above $0.24 could signal a 62–100% potential upside.
Using VWAP across multiple timeframes helps identify both short-term and long-term trends.
💡 My strategy combines VWAP with Z-score deviations to pinpoint high-probability moves, this is what sets my approach apart.
Key Points:
- VWAP levels indicate significant support and resistance zones.
- The highlighted box represents the price expected on November 30 (note: November has 30 days, not 31).
- A daily close above $0.24 could signal a 62–100% potential upside.
Using VWAP across multiple timeframes helps identify both short-term and long-term trends.
💡 My strategy combines VWAP with Z-score deviations to pinpoint high-probability moves, this is what sets my approach apart.
交易進行
Key Updates:- Price respected the projected November 30 target zone, validating the VWAP structure.
- We have now seen increased stability above the $0.24 level, which on Nov 10 was the key trigger for a potential 62–100% upside move.
What this means now:
- As long as price holds above the daily VWAP and maintains structure above $0.24, the bullish scenario remains intact.
- Any retest of VWAP (daily or weekly) may offer high-probability entries, especially if Z-score returns to neutral (0 to ±0.5).
💡 When the volume is the source, the price is the advertiser, and time is the regulator and right now, all three are aligned. The move isn’t just expected, it’s inevitable.

免責聲明
這些資訊和出版物並非旨在提供,也不構成TradingView提供或認可的任何形式的財務、投資、交易或其他類型的建議或推薦。請閱讀使用條款以了解更多資訊。
免責聲明
這些資訊和出版物並非旨在提供,也不構成TradingView提供或認可的任何形式的財務、投資、交易或其他類型的建議或推薦。請閱讀使用條款以了解更多資訊。