
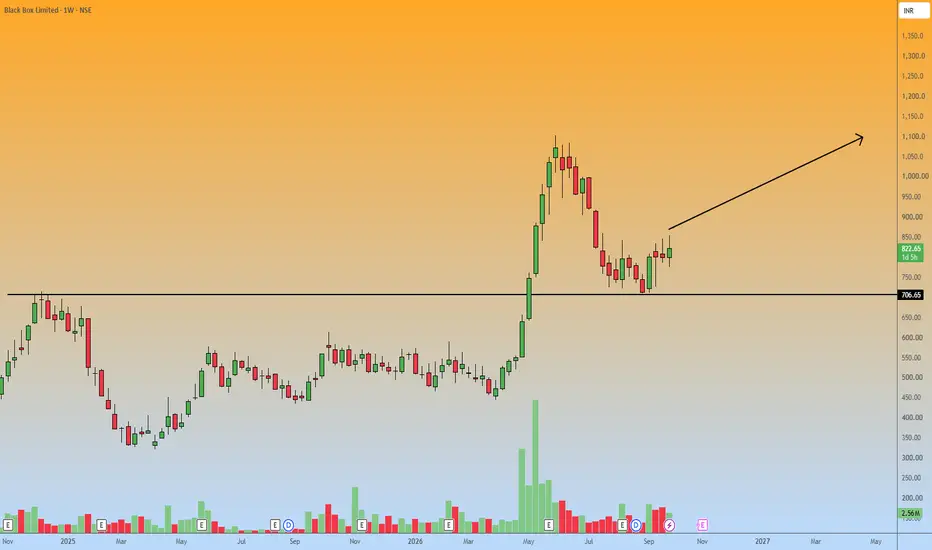
The weekly chart for Black Box Limited reveals a clear technical setup following a textbook retest of historical structure.
After a massive volume-backed rally that peaked near the 1,100 mark, the stock underwent a natural retracement.
It has now successfully pulled back to a critical horizontal support zone at exactly 706.65.
The recent price action shows a strong bullish bounce off this 706.65 level, indicating that buyers are aggressively defending this previous breakout area.
With the asset currently trading around 823.00, this structural retest provides a solid foundation for a long position, adhering to the guideline of explaining the core reasoning behind the analysis.
Bias: Long
Entry Point: Consider an initial entry near the current market price of 823.00, while looking to accumulate on any minor pullbacks into the 780–810 zone to optimize the risk-to-reward ratio.
Target: The primary upside target is a retest of the previous major swing high near 1,100.
A secondary, more conservative target can be placed at the intermediate resistance around 950.
Stop Loss: A strict stop loss should be placed below the primary 706.65 support line.
A weekly close below 680 would break the market structure and immediately invalidate this bullish thesis.
After a massive volume-backed rally that peaked near the 1,100 mark, the stock underwent a natural retracement.
It has now successfully pulled back to a critical horizontal support zone at exactly 706.65.
The recent price action shows a strong bullish bounce off this 706.65 level, indicating that buyers are aggressively defending this previous breakout area.
With the asset currently trading around 823.00, this structural retest provides a solid foundation for a long position, adhering to the guideline of explaining the core reasoning behind the analysis.
Bias: Long
Entry Point: Consider an initial entry near the current market price of 823.00, while looking to accumulate on any minor pullbacks into the 780–810 zone to optimize the risk-to-reward ratio.
Target: The primary upside target is a retest of the previous major swing high near 1,100.
A secondary, more conservative target can be placed at the intermediate resistance around 950.
Stop Loss: A strict stop loss should be placed below the primary 706.65 support line.
A weekly close below 680 would break the market structure and immediately invalidate this bullish thesis.

免責聲明
這些資訊和出版物並非旨在提供,也不構成TradingView提供或認可的任何形式的財務、投資、交易或其他類型的建議或推薦。請閱讀使用條款以了解更多資訊。
免責聲明
這些資訊和出版物並非旨在提供,也不構成TradingView提供或認可的任何形式的財務、投資、交易或其他類型的建議或推薦。請閱讀使用條款以了解更多資訊。